Global Warming Science: www.appinsys.com/GlobalWarming
Pacific Decadal Oscillation (PDO)
[last update: 2011/03/02]
|
It is only in recent years that scientists are starting to recognize the influence of atmospheric and oceanic cycles in influencing climate.
A 2008 study – “Oceanic Influences on Recent Continental Warming”, by Compo, G.P., and P.D. Sardeshmukh, (Climate Diagnostics Center, Cooperative Institute for Research in Environmental Sciences, University of Colorado, and Physical Sciences Division, Earth System Research Laboratory, National Oceanic and Atmospheric Administration), Climate Dynamics, 2008) [http://www.cdc.noaa.gov/people/gilbert.p.compo/CompoSardeshmukh2007a.pdf] states: “Evidence is presented that the recent worldwide land warming has occurred largely in response to a worldwide warming of the oceans rather than as a direct response to increasing greenhouse gases (GHGs) over land. Atmospheric model simulations of the last half-century with prescribed observed ocean temperature changes, but without prescribed GHG changes, account for most of the land warming. … Several recent studies suggest that the observed SST variability may be misrepresented in the coupled models used in preparing the IPCC's Fourth Assessment Report, with substantial errors on interannual and decadal scales. There is a hint of an underestimation of simulated decadal SST variability even in the published IPCC Report.”
This document describes the Pacific Decadal Oscillation (PDO).
|
See also the additional documents on:
- Atlantic Multi-decadal Oscillation (AMO)
- PDO + AMO Influences
- Arctic Oscillation (AO) / North Atlantic Oscillation (NAO)
- El Nino / Southern Oscillation (ENSO)
|
|
|
The Pacific Decadal Oscillation (PDO)
The Pacific Decadal Oscillation (PDO) was defined by fisheries scientist Steven Hare in the mid-1990’s, based on observations of Pacific fisheries cycles. The PDO index is calculated from sea surface temperatures and sea level pressures. An overview of the PDO is given by Nathan Mantua (Joint Institute for the Study of the Atmosphere and Oceans, University of Washington) [http://www.atmos.washington.edu/~mantua/REPORTS/PDO/PDO_egec.htm].
The PDO goes through warm and cool phases of the cycle with phases typically lasting about 30 years. The causes of the oscillation are currently unknown. A good source of information on the PDO is http://jisao.washington.edu/pdo/.
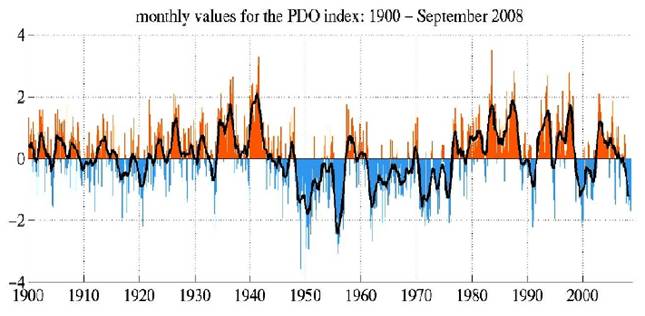
The following figure is from that web site and shows the monthly PDO index from 1900 to September 2008.
PDO Index 1900 – September 2008
The recent phases of the PDO can be seen in the above figure, with a cool phase starting around 1945 and switching to a warm phase in 1977. It appears that 2008 may be the start of the next cool phase. According to the above-mentioned PDO web site: “Major changes in northeast Pacific marine ecosystems have been correlated with phase changes in the PDO; warm eras have seen enhanced coastal ocean biological productivity in Alaska and inhibited productivity off the west coast of the contiguous United States, while cold PDO eras have seen the opposite north-south pattern of marine ecosystem productivity.”
Hare and Mantua (“Empirical evidence for North Pacific regime shifts in 1977 and 1989”, Progress in Oceanography, 2000) [http://www.iphc.washington.edu/Staff/hare/html/papers/ei/ei.pdf] state: “It is now widely accepted that a climatic regime shift transpired in the North Pacific Ocean in the winter of 1976–77. This regime shift has had far reaching consequences for the large marine ecosystems of the North Pacific. Despite the strength and scope of the changes initiated by the shift, it was 10–15 years before it was fully recognized. Subsequent research has suggested that this event was not unique in the historical record but merely the latest in a succession of climatic regime shifts.”
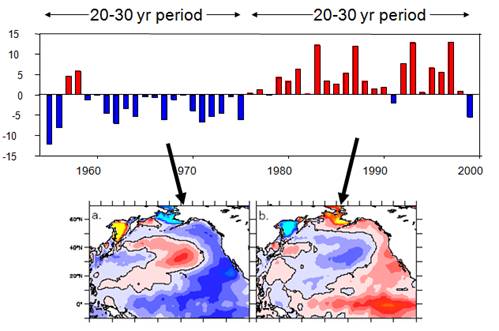
The following figure is from a NOAA study of the impact of the PDO variability on the California Current ecosystem and shows the approximately 60-year cycle of the PDO and the corresponding northern Pacific Ocean temperature regimes [www.nwr.noaa.gov/Salmon-Hydropower/Columbia-Snake-Basin/upload/Briefings_3_08.ppt]
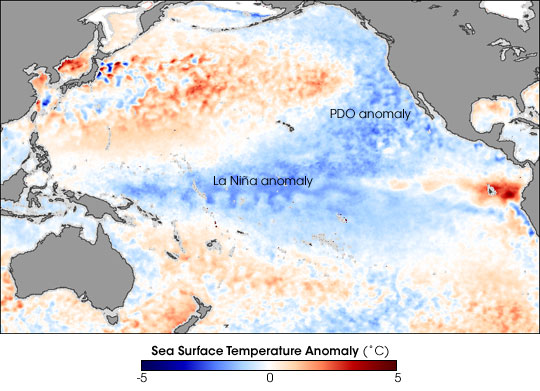
The following figure is from the NASA Earth Observatory, April 2008. It shows the sea surface temperature anomaly in the Pacific Ocean from April 14–21, 2008 as measured by satellite. The anomaly compares the recent temperatures with an average from 1985–1997. Places where the Pacific was cooler than normal are blue, places where temperatures were average are white, and places where the ocean was warmer than normal are red. [http://earthobservatory.nasa.gov/Newsroom/NewImages/images.php3?img_id=18012 ]. The NASA article states: “while the La Niña was weakening, the Pacific Decadal Oscillation—a larger-scale, slower-cycling ocean pattern—had shifted to its cool phase. … The shift in the PDO can have significant implications for global climate, affecting Pacific and Atlantic hurricane activity, droughts and flooding around the Pacific basin, the productivity of marine ecosystems, and global land temperature patterns.”
Sea Surface Temperature Anomaly April 14-21, 2008 Compared to 1985 – 1997 Average
Addressing the Washington Policymakers in Seattle, WA, Dr. Don Easterbrook (Dept. of Geology, Western Washington University) said that “shifting of the Pacific Decadal Oscillation (PDO) from its warm mode to its cool mode virtually assures global cooling for the next 25-30 years and means that the global warming of the past 30 years is over.” [http://icecap.us/images/uploads/WashingtonPolicymakersaddress.pdf]
The following table summarizes North American climate anomalies associated with PDO (from [http://www.atmos.washington.edu/~mantua/REPORTS/PDO/PDO_egec.htm]).
Another good source of information on the PDO is: http://www.intellicast.com/Community/Content.aspx?a=126.
|
|||||||||||||||||||||||||||
|
PDO Links to Climatic Effects
Many studies have shown that the major climatic events in the US are linked to cycles in ocean temperatures. Here are some PDO examples:
NASA Explains 'Dust Bowl' Drought (NASA/Goddard Space Flight Center (2004, March 19).) [http://www.sciencedaily.com/releases/2004/03/040319072053.htm]: “cooler than normal tropical Pacific Ocean temperatures and warmer than normal tropical Atlantic Ocean temperatures contributed to a weakened low-level jet stream and changed its course. The jet stream, a ribbon of fast moving air near the Earth's surface, normally flows westward over the Gulf of Mexico and then turns northward pulling up moisture and dumping rain onto the Great Plains. As the low level jet stream weakened, it traveled farther south than normal. The Great Plains dried up and dust storms formed. Analysis of other major U.S. droughts of the 1900s suggests a cool tropical Pacific was a common factor.”
Temperature of Pacific Ocean Influences Midwest Rains (University Of Illinois At Urbana-Champaign (1997, September 11).) [http://www.sciencedaily.com/releases/1997/09/970911034536.htm]: “The flood of 1993 and the drought of 1988 raised serious questions about the causes of summertime climatic fluctuations over the central United States … sea-surface temperatures in the Pacific Ocean affect both the position and the intensity of the jet stream over the central United States, which in turn modifies the circulation pattern from the gulf. "Warmer sea-surface temperatures shift the jet stream farther south, leading to more storm activity, which pumps more moisture up from the gulf," Ting said. "In contrast, cooler sea-surface temperatures shift the jet stream farther north, resulting in reduced storm activity and drier conditions.”
The Significance of the 1976 Pacific Climate Shift in the Climatology of Alaska (Geophysical Institute, University of Alaska, 2004) [http://climate.gi.alaska.edu/ResearchProjects/pages/AKpaper10.html]: “In 1976, the North Pacific region, including Alaska, underwent a dramatic shift to a climate regime that saw great increases in winter and spring temperatures … The shift in the climate regime now is known to have coincided with a shift in the phase of the Pacific Decadal Oscillation (PDO). …all of the regions in sub- Arctic Alaska have experienced a net cooling since 1977.”
Tropical Pacific Decadal Variability and Global Warming (Amy J. Bratcher & Benjamin S. Giese, Department of Oceanography, Texas A&M University, Geophysical Research Letters, 29(19), 2002) [http://www.agu.org/pubs/crossref/2002/2002GL015191.shtml]: “An analysis of ocean surface temperature records show that low frequency changes of tropical Pacific temperature lead global surface air temperature changes by about 4 years. Anomalies of tropical Pacific surface temperature are in turn preceded by subsurface temperature anomalies in the southern tropical Pacific by approximately 7 years. The results suggest that much of the decade to decade variations in global air temperature may be attributed to tropical Pacific decadal variability. The results also suggest that subsurface temperature anomalies in the southern tropical Pacific can be used as a predictor for decadal variations of global surface air temperature. Since the southern tropical Pacific temperature shows a distinct cooling over the last 8 years, the possibility exists that the warming trend in global surface air temperature observed since the late 1970's may soon weaken.”
|
|||||||||||||||||||||||||||
|
PDO Links to US West Coast / Alaska / Hawaii
Washington / Oregon
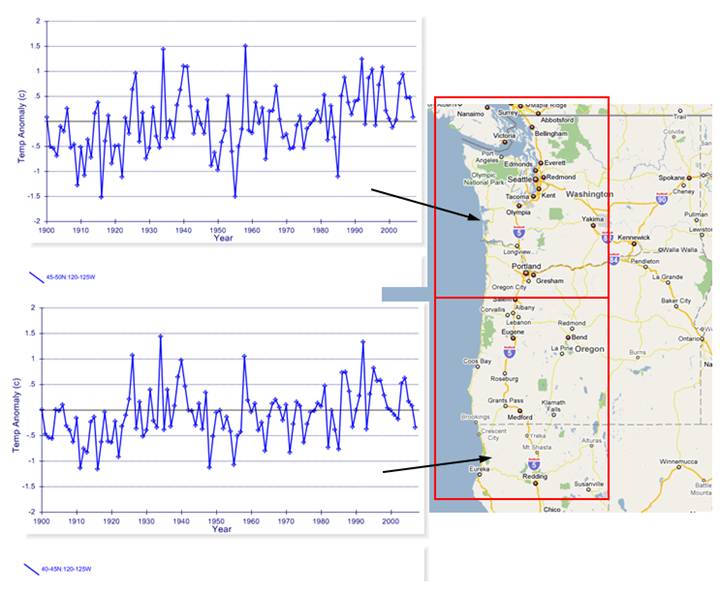
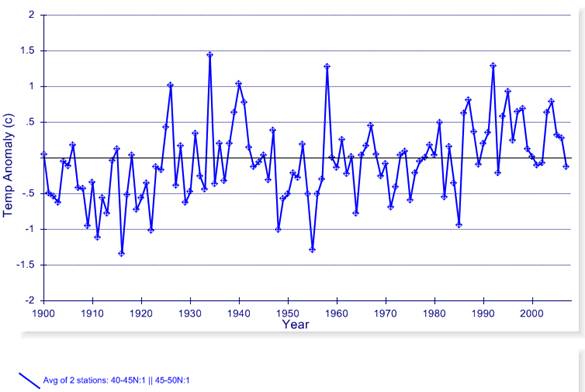
The following figure shows the annual mean temperature anomalies for the two 5x5 degree grids covering the Pacific Northwest coast of the U.S. -- western Oregon and Washington from 1900 to 2007. This data is from the Hadley Climatic Research Unit (HadCRU) as used by the IPCC.
The following figure shows the average of the two grids shown above. The next figure superimposes the two-grid average annual temperature anomaly (changed to green) on the Pacific Decadal Oscillation (PDO). A strong correlation exists between the PNW coastal temperatures and the PDO.
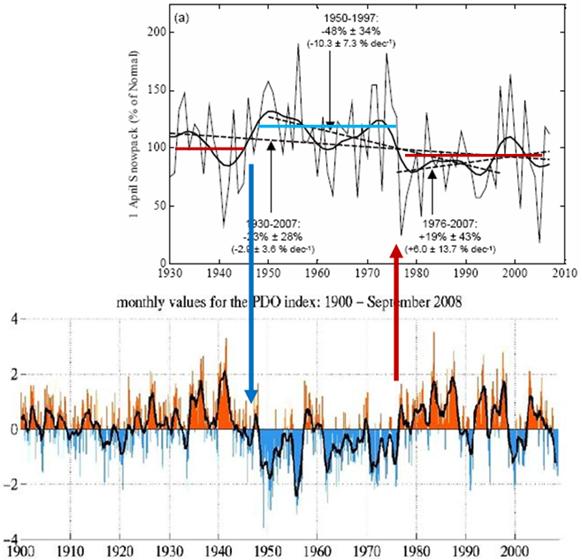
The PDO is also related to the Cascades snowpack. The following figure compares the Cascades snowpack to the Pacific Decadal Oscillation (PDO). The PDO is derived from sea surface temperatures and sea level pressures in the North Pacific Ocean. The changes in general snowpack levels correspond with the shifts in the PDO between negative and positive phases. The negative phase of the PDO corresponds to increased snowpack levels. (See http://www.appinsys.com/GlobalWarming/CascadesSnowpack.htm for more details on the snowpack)
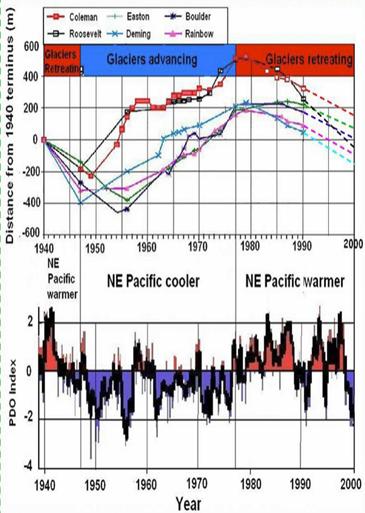
Don Easterbrook (Geologist at Western Washington University) published the following figure showing the correspondence between PDO and glaciers on Mount Baker, Washington [http://www.ac.wwu.edu/~dbunny/research/global/215.pdf]
California
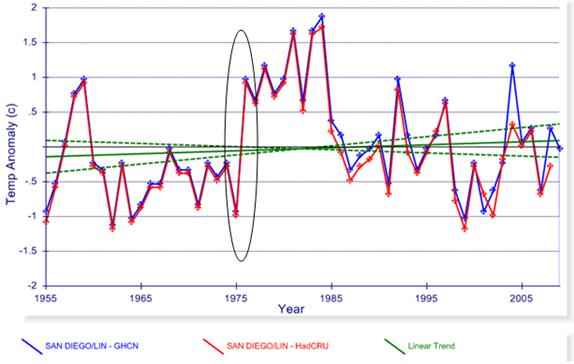
The following figure shows the average annual temperature anomaly for San Diego from the NOAA GHCN database compared with the Hadley CRUTEM3 database for 1955-2009. There is no statistically significant warming or cooling trend. However, a significant warming event occurred in 1976 - this is the 1976 Pacific climate shift.
The following figure shows the temperature from above changed to green and superimposed on the PDO. The strong correlation is clear to see.
(See: http://www.appinsys.com/GlobalWarming/SanDiego.htm for more info on the cooling summer trend in San Diego)
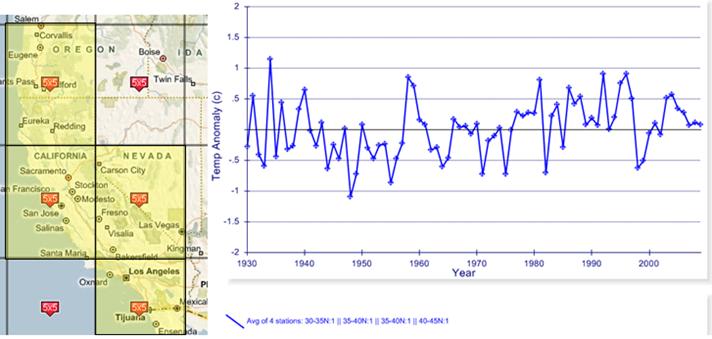
The following figure shows the average annual temperature anomalies for the average of the four 5x5 degree grids covering California for 1930 – 2009 (indicated in yellow on the map).
This 5x5 degree gridded data is from the Hadley/Climatic Research Unit (CRU) CRUTEM3 database (IPCC uses CRU data), plotted at: [http://www.appinsys.com/GlobalWarming/climate.aspx]
The following figure superimposes the above temperature data changed to green, on the PDO. While CO2 continues to simply increase, the California temperature follows the trend in PDO.
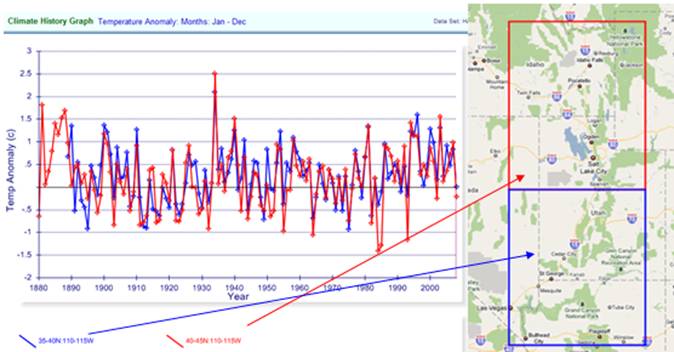
Utah
The following figure shows the annual average temperature anomalies for the two 5x5 degree grids covering most of Utah. This is from the Hadley Climatic Research Unit (HadCRU) CRUTEM3 database used by the IPCC (plotted at http://www.appinsys.com/GlobalWarming/climate.aspx). The warmest year (as for the United States as a whole) was 1934.
The following figure shows the average annual temperature anomalies for the averaged two 5x5 degree grids shown above, changed to green and superimposed on the PDO showing the strong correlation.
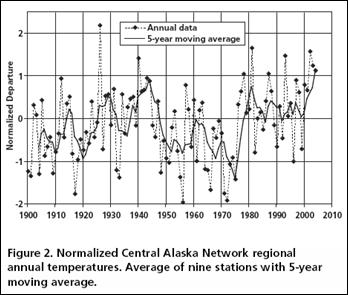
Alaska
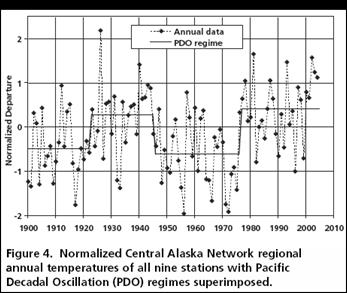
The Central Alaska Inventory and Monitoring Network monitors the climate in the National Parks of Alaska. They provide the first two figures shown below. The report states: “The strongest and most consistent of the observed correlations for the CAKN analysis, as in the other studies mentioned above, is between annual, and especially winter, temperature and the PDO” [http://www.nps.gov/akso/AKParkScience/symposium2006/sousanes.pdf]. They also make the statement: “the net change in annual temperatures since 1920 is less that 0.5 degree F. These results highlight the importance of defining the period of record when analyzing long-term trends. If a 30-year record were analyzed it would show significant warming in the region, but with 80 years of data the large decadal variability of the climate becomes more apparent.”
The following figure superimposes the Central Alaska temperature data from above (changed to green) on the PDO data.
Many studies have also shown a strong correlation between temperatures and other climatic events in Alaska with the PDO. See www.appinsys.com/GlobalWarming/RS_Alaska.htm for further information on this.
Hawaii
The PDO shows a strong correlation with sea level fluctuations at Hilo, Hawaii as shown in the following figure (sea level shown as green dots).
See the Hawaii Regional Study http://www.appinsys.com/GlobalWarming/RS_Hawaii.htm for more details on this.
|
|||||||||||||||||||||||||||
|
PDO Links to Fisheries
The PDO shows a strong correlation with sardine catch. A report about the sardine fishery states: “Fish scales found in sediments of the Santa Barbara Basin reveal that, over the past 1,700 years, West Coast sardine populations seem to follow a 60-year cycle of abundance and disappearance (Baumgartner, Soutar et al. 1992).” [http://www.montereybayaquarium.org/cr/cr_seafoodwatch/content/media/MBA_SeafoodWatch_PacificSardineReport.pdf] The following figure compares Pacific sardine catch with the PDO (see www.appinsys.com/GlobalWarming/ZooplanktonSardines.htm for more info on this).
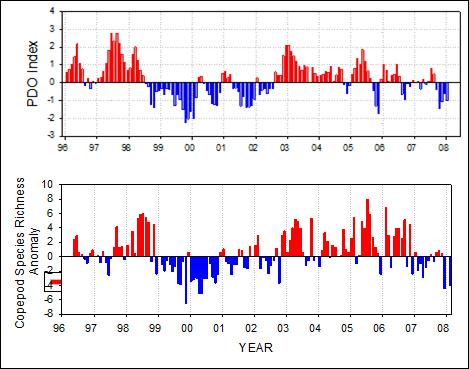
The following figure shows a strong correlation between the PDO and zooplankton (copepod) in the Pacific Northwest from a NOAA study of the impact of the PDO variability on the California Current ecosystem [www.nwr.noaa.gov/Salmon-Hydropower/Columbia-Snake-Basin/upload/Briefings_3_08.ppt]
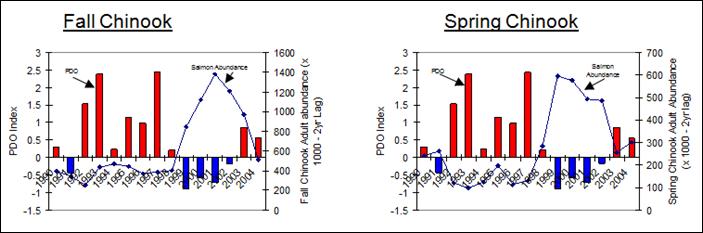
The following figure is from the same study showing a strong negative correlation between the PDO and California Chinook salmon abundance.
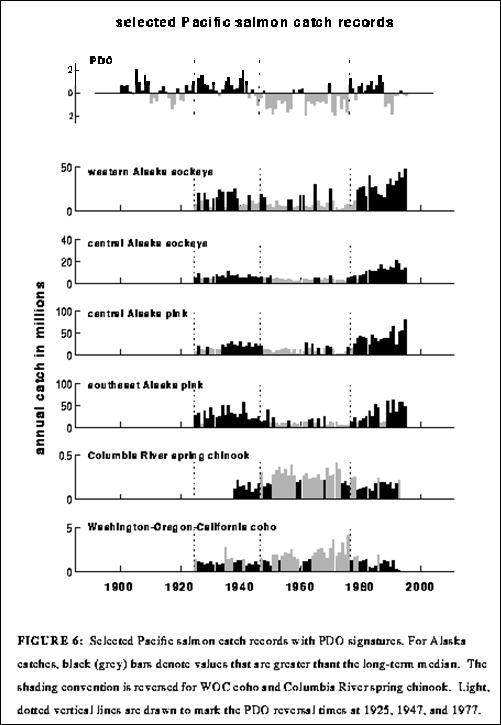
The following figure is from a study of the impacts of the PDO on salmon production. It shows a positive correlation with the PDO for Alaskan salmon: “A remarkable characteristic of Alaskan salmon abundance over the past half-century has been the large fluctuations at interdecadal time scales which resemble those of the PDO. …Time series for Washington-Oregon-California (WOC) coho and Columbia River spring chinook landings tend to be out of phase with the PDO index. … Recent work suggests that the marine ecological response to the PDO-related environmental changes starts with phytoplankton and zooplankton at the base of the food chain and works its way up to top level predators like salmon” [http://www.atmos.washington.edu/~mantua/REPORTS/PDO/pdo_paper.html]
|
|||||||||||||||||||||||||||
|
PDO – Solar Connection
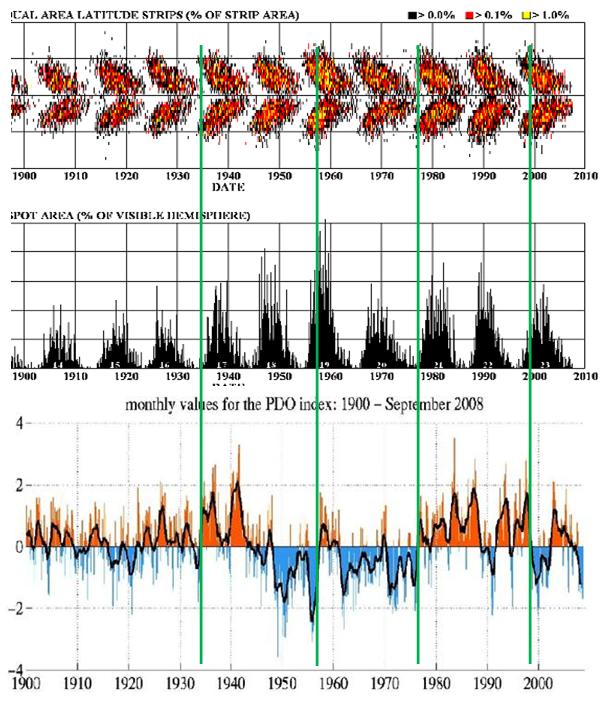
The following figure compares the major PDO events with the sunspot cycles (the sunspot cycle figure below is from: http://solarscience.msfc.nasa.gov/SunspotCycle.shtml). The major PDO events occur at the start of a sunspot cycle on an approximate 22-year cycle (22 years is also the solar Hale Cycle – the sun’s magnetic field reverses with each sunspot cycle and thus after two sunspot cycles the magnetic field has completed a reversal cycle – a Hale Cycle – and is back to where it started). In the early 1900’s the sunspot activity was quite low and there were no major PDO events. (The first major PDO event in the 1900s was in 1934 – the warmest year on record in the United States.)
|
|||||||||||||||||||||||||||
|
PDO – ENSO Connection
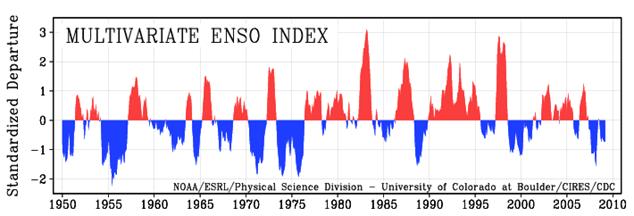
The PDO is highly influenced by the El Nino / Southern Oscillation (ENSO). The following figure shows the Multivariate El Nino / Southern Oscillation Index (MEI) calculated from sea-level pressure, zonal and meridional components of the surface wind, sea surface temperature, surface air temperature, and total cloudiness fraction of the sky (from http://www.cdc.noaa.gov/people/klaus.wolter/MEI/).
(See www.appinsys.com/GlobalWarming/ENSO.htm for details on the El Nino phenomenon.)
The next figure shows the ENSO-MEI from above, changed to yellow / green, superimposed on the PDO. This shows that although the PDO is calculated from different parameters it is highly dependent on the ENSO.
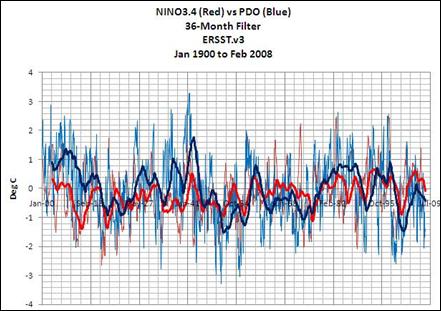
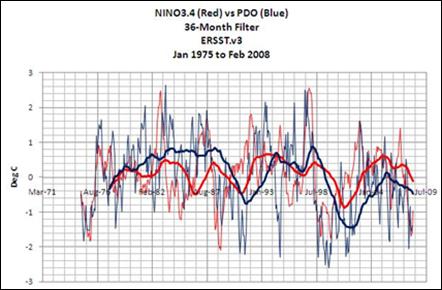
A 2003 study (Newman et al, “ENSO-Forced Variability of the Pacific Decadal Oscillation”, Journal of Climate, 2003) [http://www.esrl.noaa.gov/psd/people/gilbert.p.compo/Newmanetal2003.pdf] states: “Variability of the Pacific decadal oscillation (PDO), on both interannual and decadal timescales, is well modeled as the sum of direct forcing by El Nin˜o–Southern Oscillation (ENSO), the ‘‘reemergence’’ of North Pacific sea surface temperature anomalies in subsequent winters, and white noise atmospheric forcing.”
Bob Tisdale provides some comparisons of NINO 3.4 SST with the PDO index [http://bobtisdale.blogspot.com/2008/06/chicken-or-egg-pdo-or-enso.html] The following figures are from his page.
|
|||||||||||||||||||||||||||