Global Warming Science -
www.appinsys.com/GlobalWarming
San Diego, CA - Cooling for the last 50 Years
[last update: 2010/08/09]
San Diego 2010 - Missing Summer
Friday Aug 6, 2010, NBC San Diego: “July
proved to be nearly the coldest on record in nearly a hundred years.
Now, 6 days into August, our unseasonably cool weather continues, and
today we have a chance of seeing the coolest August day since record
keeping began in 1875. … Since weather records began, the official high
temperature reading at Lindbergh Field has never been lower than 66
degrees on an August day.
National Weather Service thinks we may see a
high of 65 today, making it the new record.”
[http://www.nbcsandiego.com/news/local-beat/Could-be-Coldest-August-Day-on-Record---100122309.html]
Of course weather isn't climate (although climate is weather averaged
over 30 years), so a cold summer doesn't mean anything. The following
figure shows the San Diego maximum July-August temperatures for
1955-2009. There is a cooling trend in summer temperatures in San Diego
over the last 50 years. So this summer of 2010 is consistent with the
trend.
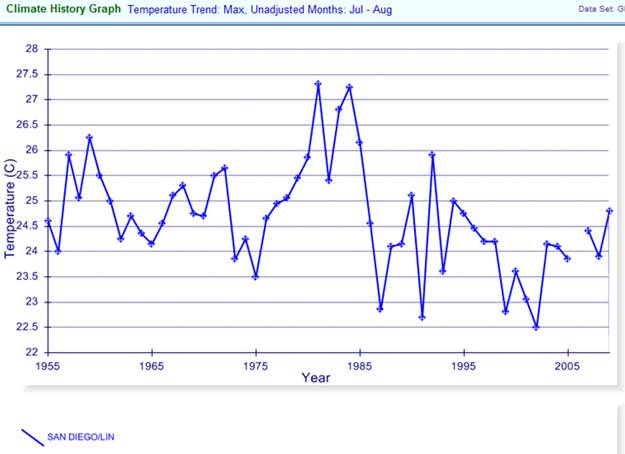
(San Diego/Lin is the NOAA GHCN station at Lindbergh Field referred to
in the NBC article above.)
(All graphs in this article plotted at: [http://www.appinsys.com/GlobalWarming/climate.aspx])
San Diego Temperature Trends
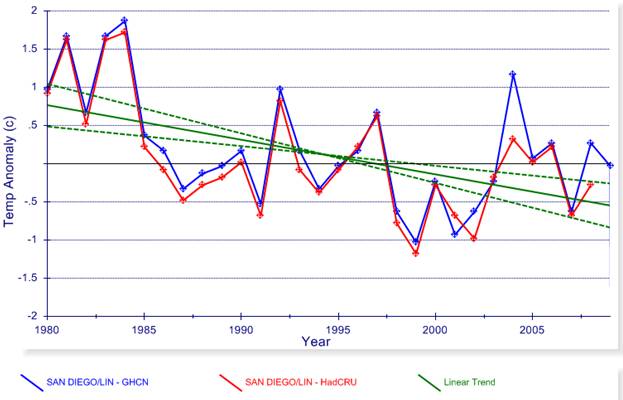
San Diego has been experiencing cooling for the last 50 years. The
following figure shows the average annual temperature anomaly for San
Diego from the NOAA GHCN database compared with the Hadley CRUTEM3
database for 1980-2009. The linear trend is statistically significant -
San Diego shows significant cooling over the last 30 years.
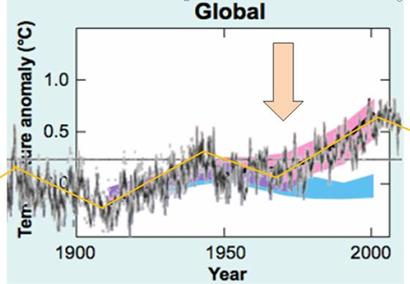
While 30 years is climate, it is not long-term climate. However, one
must keep in mind that according to the IPCC the models can reproduce
the global warming prior to 1970 using only natural forcings, as shown
in the following figure - their claim is that warming since 1970 is due
to anthropogenic CO2 (see
http://www.appinsys.com/GlobalWarming/GW_Summary.htm)
In a CRU email exchange from Edward Cook to Michael Mann in 2001,
Cook said "I think that most researchers in
global change research would agree that the emergence of a clear
greenhouse forcing signal has really only occurred since after 1970.
I am not debating this point, although I do think that there still
exists a significant uncertainty as to the relative contributions of
natural and greenhouse forcing to warming during the past 20-30 years at
least." [http://www.eastangliaemails.com/emails.php?eid=228&filename=988831541.txt]
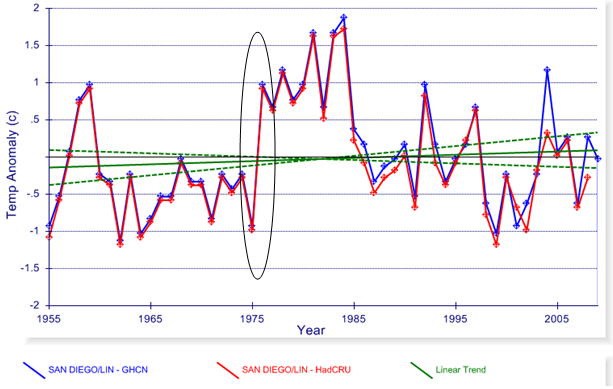
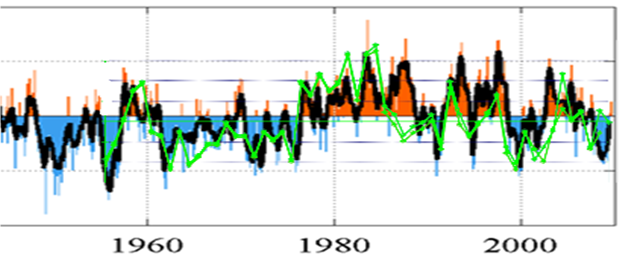
The following figure shows the average annual temperature anomaly for
San Diego from the NOAA GHCN database compared with the Hadley CRUTEM3
database for 1955-2009. There is no statistically significant warming or
cooling trend. However, a significant warming event occurred in 1976 -
this is the 1976 Pacific climate shift.
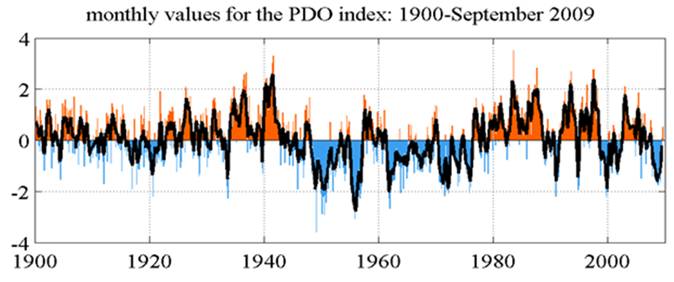
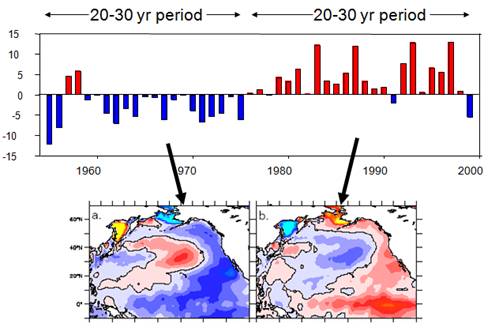
Hare and Mantua (“Empirical evidence for North Pacific regime shifts in
1977 and 1989”, Progress in Oceanography, 2000)
state: “It
is now widely accepted that a climatic regime shift transpired in the
North Pacific Ocean in the winter of 1976–77. This regime shift has had
far reaching consequences for the large marine ecosystems of the North
Pacific. Despite the strength and scope of the changes initiated by the
shift, it was 10–15 years before it was fully recognized. Subsequent
research has suggested that this event was not unique in the historical
record but merely the latest in a succession of climatic regime shifts.”
[http://www.iphc.washington.edu/Staff/hare/html/papers/ei/ei.pdf]
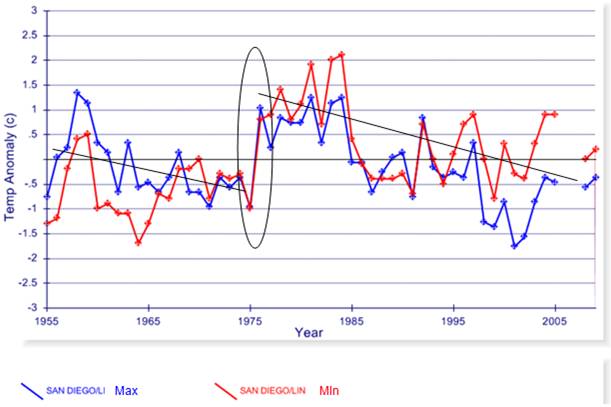
The following figure shows the annual average maximum and minimum
temperature for San Diego from the NOAA GHCN database for 1955 - 2009.
The effect of the 1976 Pacific climate shift is clearly observable -
there are cooling trends before and after. The maximum temperature
(blue) has been cooling more rapidly than the minimum temperature (red).
For more info on the 1976 climate shift, see:
http://www.appinsys.com/GlobalWarming/The1976-78ClimateShift.htm
(2010080901)