Global Warming Science - www.appinsys.com/GlobalWarming
Washington State / Cascade Snowpack
[last update: 2011/05/24]
|
Democratic Party politicians and media alarmists often claim that the Cascade Mountain snowpack has been disappearing due to man-made global warming.
“The effects of climate change are already being felt in the state of Washington in the form of … snow pack in the Cascades declining by 35%.” - Washington Governor Gregoire’s Executive Order, Feb 2007
“Snowpack levels in Washington, Oregon and California … are a fraction of what they were in the 1940s, and some snowpacks have vanished entirely.” - Time Magazine, March 2006
|
|
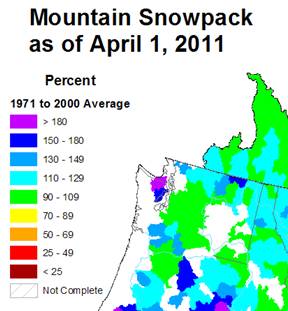
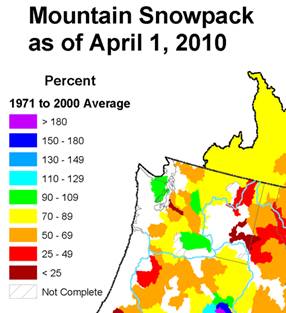
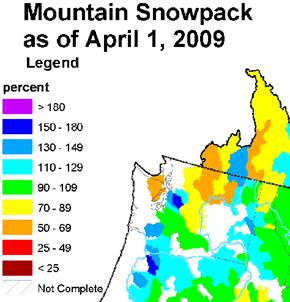
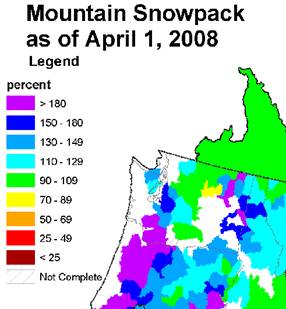
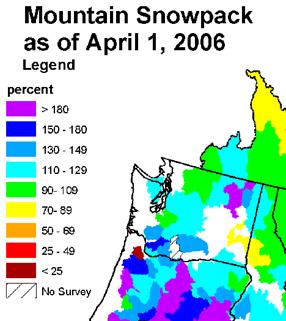
The USDA provides mountain snowpack maps for each “snow month” of the year (Jan – May) from 1980 to the present [http://www.wcc.nrcs.usda.gov/cgibin/westsnow.pl]. April is considered the critical snowpack month for areas that depend on the summer melt runoff to provide a water source. The following figures show the April snowpack for the last six years. There is a large annual variation in the snowpack.
|
|
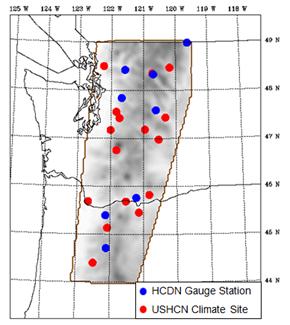
Mark Stoelinga (Research Associate Professor, Department of Atmospheric Sciences, University of Washington) conducted a study of Cascades snowpack since 1930. The following figure shows the locations of stations used in the study. [ftp://ftp.atmos.washington.edu/stoeling/presentations/PNWWW_2008_Snowpack.ppt]
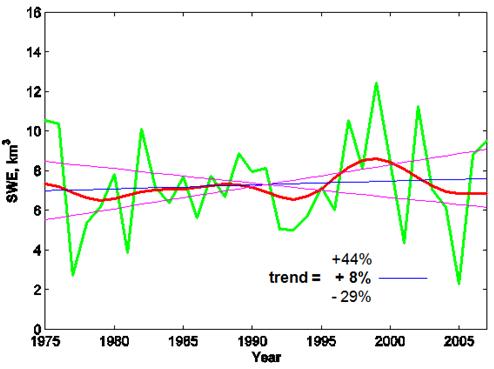
The following figure shows the April snow water equivalent (SWE) for Cascades snowpack from 1975 to 2007. Stoelinga states: “In spite of the rapid global warming, this period saw a 19% increase in snowpack in the Cascades, although this trend does not exceed the statistical uncertainty”. The statistical uncertainty is due to the annual variability.
|
|
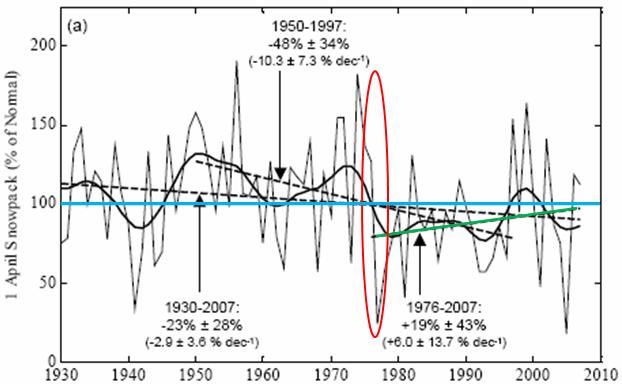
The following figure shows April snow water equivalent (SWE) for Cascades snowpack since 1930 [ftp://ftp.atmos.washington.edu/stoeling/manuscripts/SWEpaper30Oct_rendered.pdf]. Note that the blue line indicates the 100 % of normal snowpack line. The 1930 – 2007 decline is 23 +/- 28 % (i.e. not statistically significant from zero). The only significant decline took place during the Pacific Climate Shift of 1977 and since then “snowpack increased 19% during the recent period of most rapid global warming (1976-2007)” (although this change is also not statistically different from zero). (See http://www.appinsys.com/GlobalWarming/The1976-78ClimateShift.htm for more details on the 1977 climate shift.)
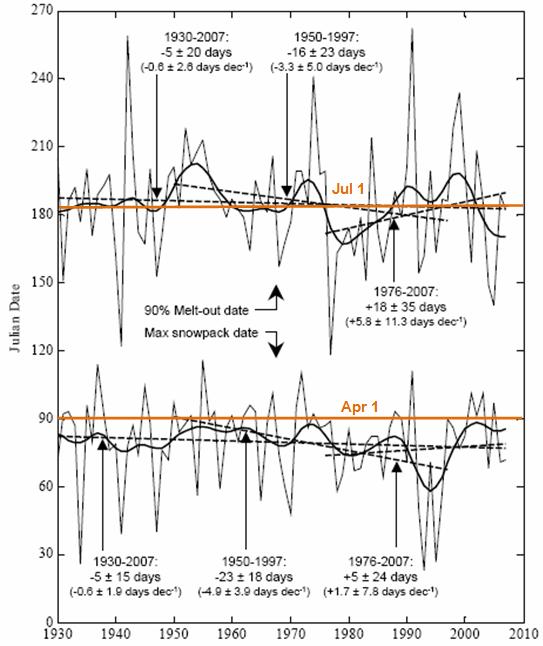
The following shows the maximum snowpack date (lower graph) and the 90% melt-out date (upper graph) – the y-axis shows the day of the year: “the dates of both maximum snowpack and 90% melt-out occur just 5 days earlier in 2007 than they did in 1930 according to the linear trends, with the threshold for a statistically significant change being at least two weeks in both cases.” In other words, no significant change in the last 80 years.
|
|
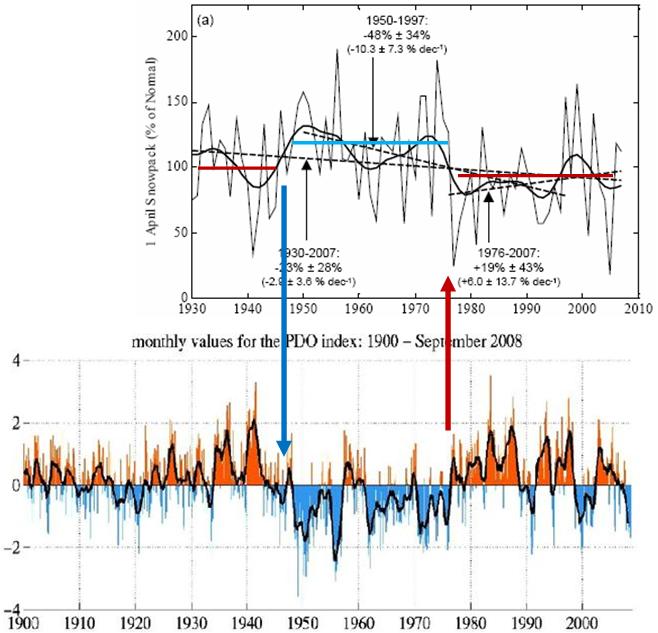
The following figure compares the snowpack to the Pacific Decadal Oscillation (PDO). The PDO is derived from sea surface temperatures and sea level pressures in the north Pacific Ocean. (See http://www.appinsys.com/GlobalWarming/PDO_AMO.htm for more detailed information on the PDO.)
The changes in general snowpack levels correspond with the shifts in the PDO between negative and positive phases. The negative phase of the PDO corresponds to increased snowpack levels.
|
|
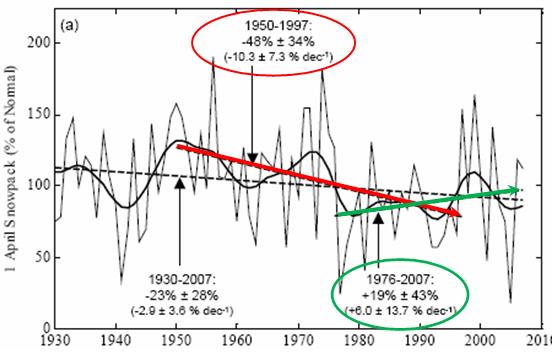
So how do the Democratic Party politicians and other climate alarmists derive their scare stories?
“April 1 snowpack in the Cascades declined about 50 percent from 1950 to 2000.” - Oregon Strategy for Greenhouse Gas Reductions, December 2004 “The average snowpack in the Cascades has declined 50 percent since 1950.” - Mayor Nickels’ letter to Seattle Times, Feb 2007
Answer: selective statistics are abused to create a false impression (i.e. using statistics to lie). The use of simple linear trends in cyclic data is rampant in climate “science” in order to hide the actual nature of the fluctuations. If they chose 1940 as the starting point, the story would be very different.
|
|
This misrepresentation by the selective misuse of statistics is significant, since the 1950-1970 period was a cooling period and according to the IPCC, CO2 has only caused warming since 1970s. And since the 1970s, the Cascades snowpack has been increasing – exactly the opposite of what the alarmists portray.
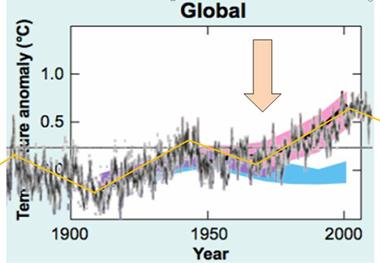
The following figure superimposes the global temperature anomalies on the IPCC graph of model outputs. (IPCC 2007 AR4 Figure SPM-4 [http://www.ipcc.ch/pdf/assessment-report/ar4/syr/ar4_syr_spm.pdf]). The blue band shows model outputs with natural forcings; the pink band shows models including anthropogenic CO2. Thus according to the IPCC, CO2 has only caused warming since the early 1970s – and since then the Cascade snowpack has an increasing trend. The period selected by the alarmists (1950-2000) for snowpack decline includes a large portion of the global cooling period, whereas during the warming period (1976-2005) the snowpack has increased.
|
|
El Nino
The Cascade mountain snowpack is influenced by the El Nino / La Nina (ENSO) phenomenon.
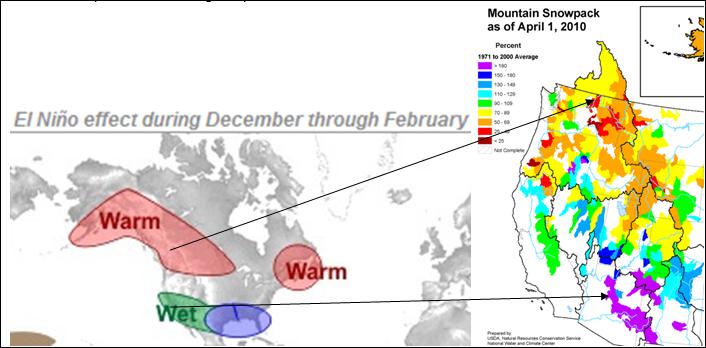
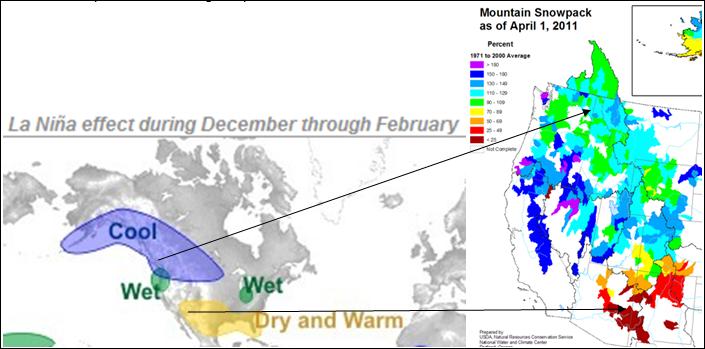
The following figures show (left) the typical winter El Nino / La Nina impacts and (right) the matching pattern on mountain snowpack. (ENSO figures from [http://www.srh.weather.gov/srh/jetstream/tropics/enso_impacts.htm])
El Nino example: Winter leading to April 2010:
La Nina example: Winter leading to April 2011:
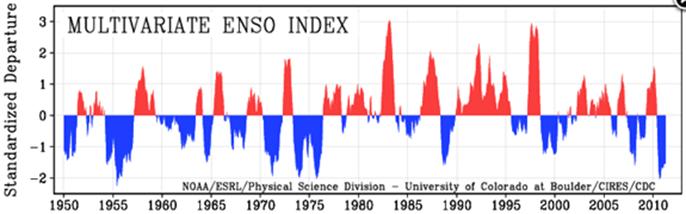
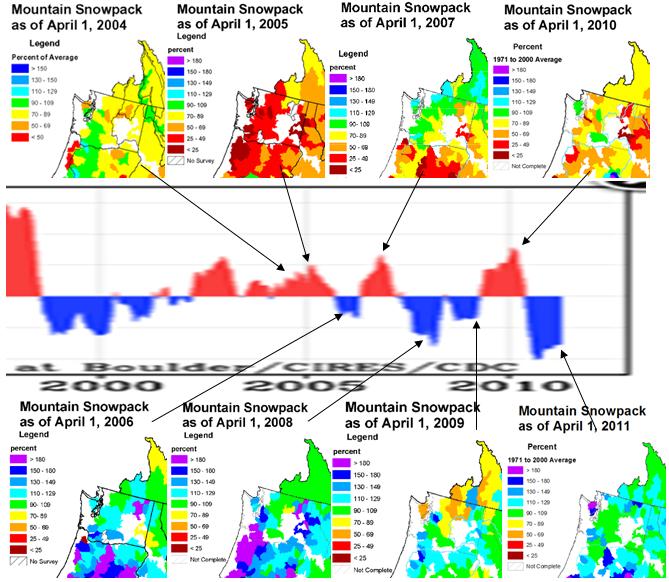
The following figure shows the Multivariate ENSO Index [http://www.cdc.noaa.gov/people/klaus.wolter/MEI/]
The following figure compares the April snowpack with the ENSO (MEI) for 2004 – 2011.
For more details about the ENSO, see: http://www.appinsys.com/GlobalWarming/ENSO.htm
|
|
Alarmism Continues Unabated
UW professor: Global Warming will happen, despite cold April [2011] [http://mynorthwest.com/?nid=11&sid=471491] “You may be yearning for warmer days after what is shaping up to be one of the coldest Aprils [2011] in Western Washington's history. University of Washington Atmospheric Sciences Professor Cliff Mass: "The fact that we haven't warmed up much doesn't mean anything. The warming is coming, but it's not going to be really significant until the second half of the century," Mass said. "We are kind of lucky, I guess you could look at it that way, that the warming is going to be slower here than most places," said Mass. "In fact, if you look at the snow pack in the Cascades, it hasn't changed in the last 30 years." … "It's going to get warmer, enough that we're going to lose a substantial amount of the snow pack”
Mass seems to either to not know about the Pacific Decadal Oscillation (PDO) or simply chooses to remain an alarmist to keep the funds flowing.
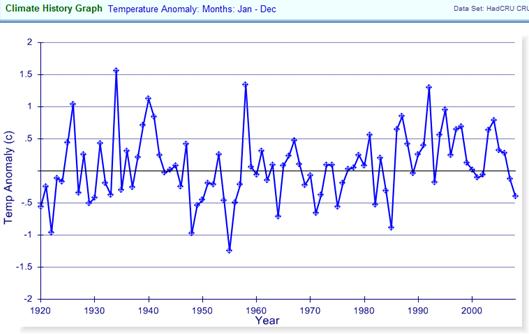
The following figure shows the average annual temperature anomalies for the two 5x5 degree grids covering the Cascades area from the Hadley CRUTEM3 data (from [http://www.appinsys.com/GlobalWarming/climgraph.aspx?pltparms=HCRUG100AJanDecA192020080900210AR40-45N:120-125Wx45-50N:120-125Wx]). Temperatures have been declining since 1992. The next figure superimposes the two-grid average annual temperature anomaly (changed to green) on the Pacific Decadal Oscillation (PDO). The PDO figure is from http://jisao.washington.edu/pdo/. A strong correlation exists between the PNW coastal temperatures and the PDO. CO2 does not affect the climate in Washington. (Although alarmists like Mass claim it “will”).
Average Annual Temperature Anomalies
Temperature Anomalies (Green) Superimposed on PDO
For more details on this see: http://www.appinsys.com/GlobalWarming/RS_Washington_usa.htm#pdo
|
|
Despite alarmist claims, the Cascade Mountain snowpack is governed by the ENSO / PDO. Thus, the snowpack has absolutely nothing to do with anthropogenic CO2-caused global warming.
|
|
|