Zooplankton / Pacific Sardine and Related Fisheries
[last update: 2009/01/31]
The role of zooplankton in the Pacific Ocean is a significant one. Zooplankton form one of the bases of the food chain with several fish species in the Pacific feeding on zooplankton. It is the major food source for the Pacific sardine (Sardinops sagax). “The Pacific sardine ranges throughout the temperate Pacific, from Australia and New Zealand past Japan and along the coasts of North and South America. Near the base of the food chain, sardines are important prey for many larger fishes, as well as seabirds and marine mammals.“
Zooplankton are important in the North Pacific Ocean for transforming CO2. “During the spring, Neocalanus graze on phytoplankton that absorb CO2 through photosynthesis in the surface water, after which they migrate to deep water zones” according to a study “Zooplankton in North Pacific Ocean Absorb Substantial CO2” [http://www.japanfs.org/en/pages/026468.html]
Many of the alarmist media outlets portray global warming as causing the collapse of the zooplankton and the chain of fish species that rely on this base. An older alarmist example -- San Francisco Gate: “Warming Menaces Ocean Ecosystem” states: “More than 70 percent of the ocean's zooplankton - the tiny free-floating animals that feed the larger creatures - has disappeared since the mid-1970s, a phenomenon related to the overall rise in the ocean temperature”. [http://www.sfgate.com/cgi-bin/article.cgi?f=/examiner/archive/2000/11/19/NEWS12442.dtl&type=printable] The article does contain some honesty: “Scientists don't know whether natural cycles, including a global warming, have caused the shift. And they don't know whether the warming is induced by human activities of burning fossil fuels and releasing chemicals.”
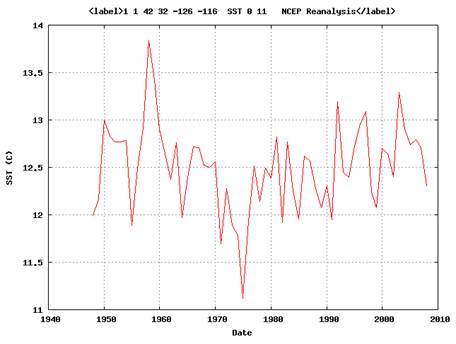
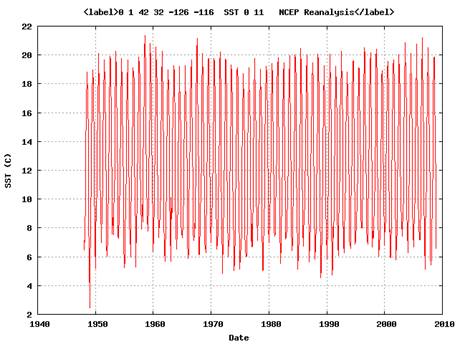
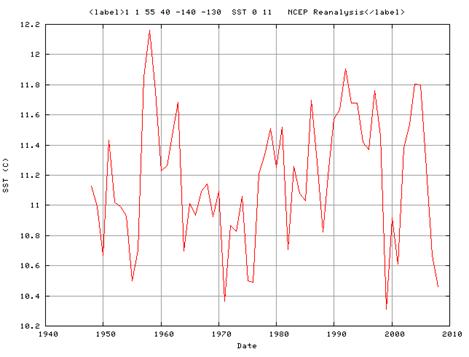
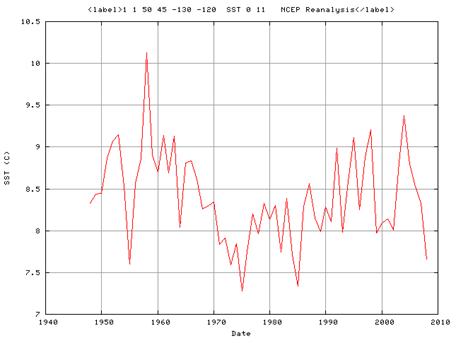
The following figures show the annual average (left) and monthly (right) sea surface temperature (SST) for the California coastal area from the NOAA Earth System Research Laboratory database [http://www.cdc.noaa.gov/cgi-bin/data/timeseries/timeseries1.pl]. Unfortunately the SST database only goes back as far as 1948. These figures illustrate that the claim of “overall rise in ocean temperature” being a cause of the zooplankton collapse does not have much evidence.
So let’s examine how the next item up the food chain – the Pacific sardine – has fared. “The sardine is an important forage species that supports a variety of predators and plays a pivotal role in the marine ecosystem. They provide prey for most marine fish predators including other fishes (tunas, yellowtail, barracuda, bonito, marlin, hake, and mackerel), sharks, seabirds (pelicans, gulls, cormorants), and marine mammals (sea lions, seals, porpoises, and whales). During their peak abundance in the 1930s and early 1940s, sardine was the dominant prey species for chinook and coho salmon in the Pacific northwest.” [http://dsp-psd.pwgsc.gc.ca/Collection/CW69-14-354-2004E.pdf]
The Monterey Bay Aquarium source cited previously states the following: “The West Coast fishery for Pacific sardines began in 1916, expanded rapidly throughout the 1920s, peaking in 1936 at more than 700,000 tons. Throughout the 1930s and 1940s, Pacific sardines supported the largest fishery in the Western Hemisphere. The fish were landed from British Columbia to California. But the fishery began to collapse in the 1940s. Catches in the northern part of the range ceased first. In this era of the fishery’s decline, the last Washington and Oregon landings were recorded in 1948, the last San Francisco landings in 1952. … California sardine fishery annual landings, were less than 100 tons per year in the 1970s, then increased to an average of 13,400 tons/year during the 1980s and almost 42,000 tons/year through the 1990s. In 1999, California landings totaled 62,600 tons and were about 74,554 mt in 2002. …Oregon’s directed fishery for sardines ceased in 1950 and did not resume again until 1999. An experimental purse-seine fishery for sardines began in Oregon and Washington in1999, and has grown dramatically since. Oregon’s landings jumped from 1.7 million pounds in 1999 to over 50 million pounds in 2002. Combined total landings of the Oregon and Washington fisheries were about 37,800 mt in 2002.”
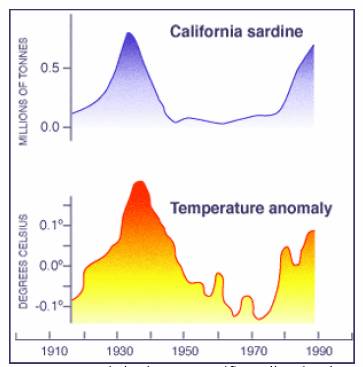
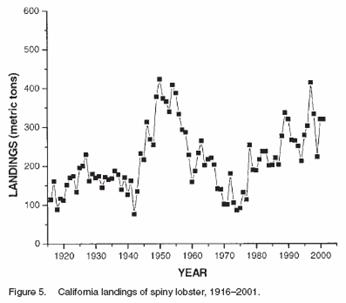
The following figure is also from the Monterey Bay Aquarium source cited previously. It shows a positive correlation between temperature and sardine catch, as indicated in the timeline stated in the previous paragraph.
The same source also states: “Fish scales found in sediments of the Santa Barbara Basin reveal that, over the past 1,700 years, West Coast sardine populations seem to follow a 60-year cycle of abundance and disappearance (Baumgartner, Soutar et al. 1992).”
The Global Ocean Ecosystem Dynamics (GLOBEC) Northeast Pacific summary states: “The catch records of sardines from the Pacific mirror that of the Alaskan salmon harvest. Historical maximum catches of California and Japanese sardines in the 1930s-early 1940's were followed by a rapid, precipitous decline during the succeeding three decades. Since the late 1970s, sardines in Peru/Chile and Japan have rebounded strongly; in fact the maximum catch of Japanese sardines during this latter period exceeded by a factor of two the maximum catches from the 1930s.” [http://globec.oce.orst.edu/nepsummary.html] The following figure is from that source.
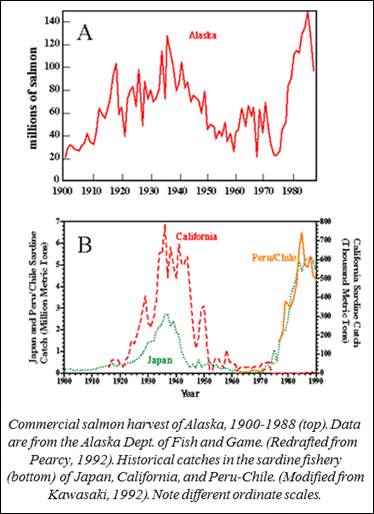
The following figure overlays the graph from B above (converted to green) on a graph of the Pacific Decadal Oscillation (PDO) (see www.appinsys.com/GlobalWarming/PDO_AMO.htm for more information on the PDO). Although the graph above contains data for both California and Peru/Chile, it correlates well with the PDO – sardine catches are highest during the warm phase of the PDO. The PDO also has approximately a 60-year cycle as observed previously for the sardines.
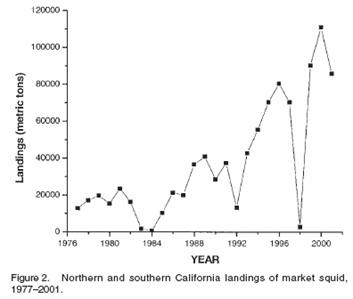
The previous sardine catch graph did not show current data for California. As it turns out, the warming occurring since the mid-1970s correlates with increased sardine fish stocks. The following figure shows California sardine catch since the late 1970s to 2001. [http://www.calcofi.org/newhome/publications/CalCOFI_Reports/v43/pdfs/CalCOFI_Rpt_Vol_43_2002.pdf]
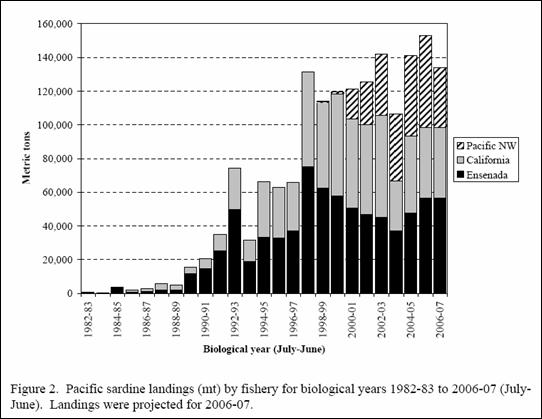
The following figure shows sardine catch since the early 1980s to 2006 for three regions including the Pacific Northwest. [http://www.pcouncil.org/cps/cpssafe/0607safe/APP1_Sardine_Assessment_2007.pdf]
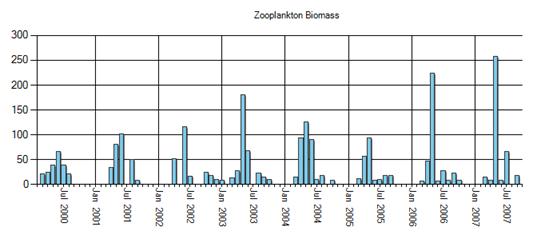
The North Pacific Marine Science Organization has a continuous plankton recording (CPR) project that was started in 2000. [http://www.pices.int/projects/CPR/BioMass/index.aspx] The following figure shows the average zooplankton biomass for the offshore BC region – the farthest south region monitored as part of the CPR. Zooplankton have been increasing during the 7 years since monitoring started.
The following figure shows the average annual SST for the offshore BC area [http://www.cdc.noaa.gov/cgi-bin/data/timeseries/timeseries1.pl]. The temperatures declined until 1970 and then increased.
An alarmist portrayal from the UK’s Independent: “Fish numbers plummet in warming Pacific” (2005): “A catastrophic collapse in sea and bird life numbers along America's Northwest Pacific seaboard is raising fears that global warming is beginning to irreparably damage the health of the oceans. The collapses in the Pacific are also down to the disappearance of plankton, though the immediate cause for this is different. Normally, winds blow south along the coast in spring and summer, pushing warmer surface waters away from the shore and allowing colder water that is rich in nutrients to well up from the sea bottom, feeding the microscopic plants called phytoplankton. These are eaten by zooplankton, tiny animals that in turn feed fish, seabirds and marine mammals. But this year the winds were extraordinarily weak and the cold water did not well up in spring as usual. Water temperatures soared to 7C above normal, which delighted bathers but caused the whole delicate system to collapse. The amount of phytoplankton crashed to a quarter of its usual level.” [http://www.independent.co.uk/environment/fish-numbers-plummet-in-warming-pacific-515074.html]
The above alarmist article refers to the Pacific Northwest. The following figure shows the average annual SST for the Pacific Northwest.
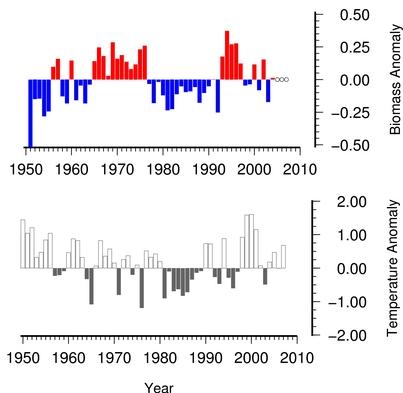
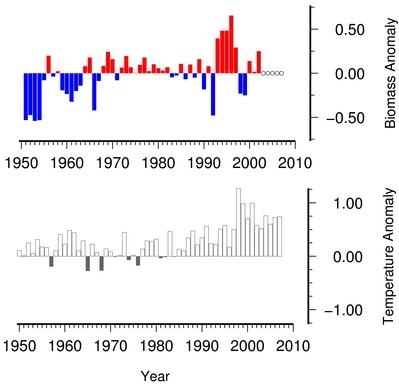
The Global Plankton Database [http://www.st.nmfs.noaa.gov/plankton/scor/time-series/frame-sites.html] provides zooplankton data for various sites around the world. The following figures show zooplankton biomass anomalies and annual temperature anomalies for four locations. The top two show Oregon (in the Pacific Northwest) and the California Current. The next two show two locations in the western Pacific near Japan. One thing that’s noticeable is the lack of correlation between the zooplankton biomass anomalies and the temperature anomalies.
Eastern North Pacific: Newport Oregon (left), California Current (right)

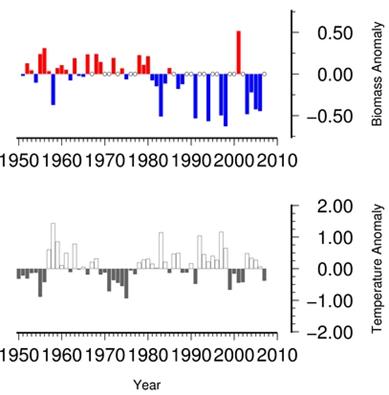
Western North Pacific: Oyashio Current (left), Kuroshio Current (right)
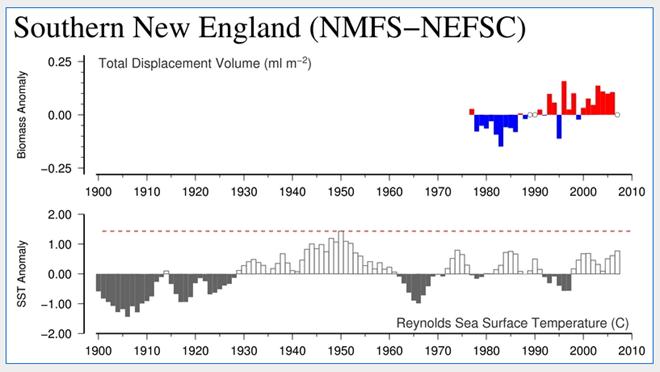
Although from the Atlantic Ocean in this case, the following figure shows zooplankton mass and SST anomalies for Southern New England in the United States. This further illustrates the lack of correlation between the zooplankton and temperature anomalies and the recent increase in zooplankton in this location.
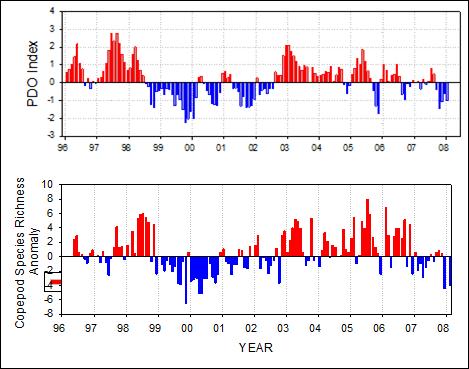
The following figure shows a strong correlation between the PDO and zooplankton (copepod) in the Pacific Northwest from a NOAA study of the impact of the PDO variability on the California Current ecosystem [www.nwr.noaa.gov/Salmon-Hydropower/Columbia-Snake-Basin/upload/Briefings_3_08.ppt]
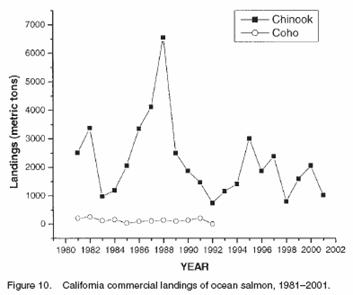
So with the reported collapse of all these fisheries, what does the recent data show? The California Cooperative Oceanic Fisheries Investigations provides a report on fisheries in California [http://www.calcofi.org/newhome/publications/CalCOFI_Reports/v43/pdfs/CalCOFI_Rpt_Vol_43_2002.pdf]. The following figures show four of the important commercial fisheries. Although salmon catch has been decreasing (labeled Figure 10), most fisheries have been increasing. I guess this “overall rise in ocean temperature” (see the California SST figures near the start of this document) is not causing a “catastrophic collapse”.

The following figure is from the NOAA PDO study cited previously. It shows a strong negative correlation between the PDO and California Chinook salmon abundance.
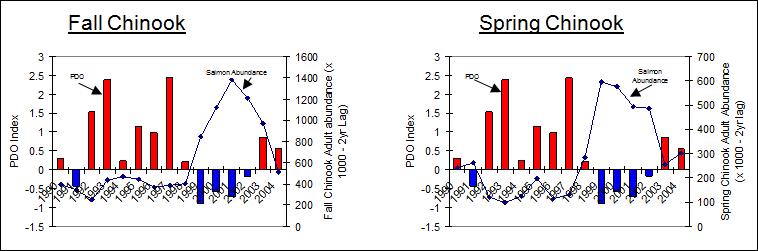
A study of the impacts of the PDO on salmon production shows a positive correlation with the PDO for Alaskan salmon, and a negative correlation for California and Pacific Northwest salmon: “Time series for Washington-Oregon-California (WOC) coho and Columbia River spring chinook landings tend to be out of phase with the PDO index. … Recent work suggests that the marine ecological response to the PDO-related environmental changes starts with phytoplankton and zooplankton at the base of the food chain and works its way up to top level predators like salmon” [http://www.atmos.washington.edu/~mantua/REPORTS/PDO/pdo_paper.html]