Global Warming Science - www.appinsys.com/GlobalWarming
Seychelles / Cancun Climate Scam
[last update: 2010/12/08]
|
At the Cancun climate summit, “Members of the Alliance of Small Island States, already suffering the ill effects of global warming, are furious that the large nations that are the big emitters of greenhouse gases aren't doing more to ensure their survival.” [http://www.latimes.com/news/local/la-me-climate-islands-20101204,0,271520,full.story]
(The L.A. Times claims the islands are suffering – but these bogus claims are easy to examine – see: http://www.appinsys.com/GlobalWarming/ClimateCash.htm#maldives for the lies involved in the islands of Maldives.)
According to the L.A. Times article: “Ronny Jumeau has no patience for diplomatic niceties. I won't shut up," said the pugnacious chief of the three-member delegation from Seychelles, an Indian Ocean archipelago. "Even when we're underwater, when the bubbles pop, you'll hear us yelling." … the former newspaper editor and natural resources minister is an old hand, having navigated previous conferences in Bali; Poznan, Poland; Bonn; and Copenhagen. "If we don't solve climate change, nothing else matters," he said, "because many of us will be wiped off the face of the Earth."”
The alleged dangers: drought and sea level rise. “Drought has left the islands, which depend on tourism, fishing and tuna canning, with a 20-day supply of drinking water, Jumeau said. Desalination plants are running at full capacity, but that means burning expensive fossil fuels, which contributes to global warming. "The cost of producing food, drinking water and everything is going up, all because some people messed up the atmosphere," Jumeau told a seminar … "It's simple," Jumeau said. "As the poles melt, we drown."”
|
|
With a GDP per capita ranking the country 62 of 229 countries in the world, Seychelles is ahead of Hungary, Poland, Russia, Argentina and many others. Seychelles’ main industries are tuna fishing, followed by tourism. While Seychelles officials view global warming as an opportunity to obtain money from western countries, their biggest problem is piracy: “Piracy is a serious threat to tuna fisheries management … The country’s revenues have dropped by 30% over the past year due to attacks from pirates based in Somalia … The press quotes the pirates as saying that international fishing vessels, including some belonging to Seychelles, illegally fish in Somali waters” [http://www.voanews.com/english/news/africa/east/Seychelles-Official-Warns-of-Threats-to-Countrys-Tuna-Industry-84478922.html]
While they are trying to scam money from “rich” countries (several countries in the EU have lower GDP per capita than Seychelles) for the phony issue of climate change, their real problem is pirates.
|
|
Seychelles Drought
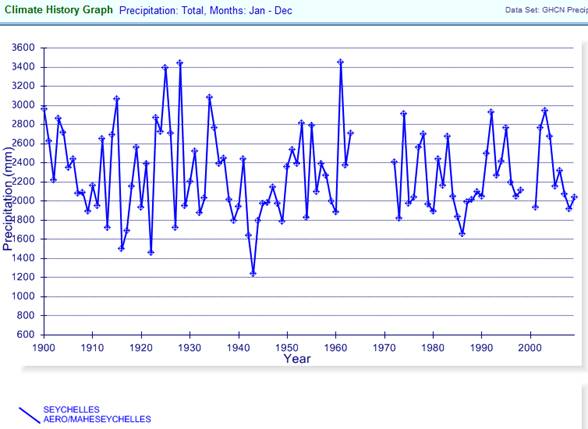
With a population of 88,000, Seychelles is composed of several small tropical islands north of Madagascar off the coast of Africa. “The climate of Seychelles is tropical, having little seasonal variation. Temperatures on Mahé rarely rise above 29 C. or drop below 24 C. The southeast monsoon from late May to September brings cooler weather, and the northwest monsoon from March to May, warmer weather. High winds are rare inasmuch as most islands lie outside the Indian Ocean cyclone belt; Mahé suffered the only such storm in its recorded history in 1862. Mean annual rainfall in Mahé averages 2,880 millimeters at sea level and as high as 3,550 millimeters on the mountain slopes. Precipitation is somewhat less on the other islands, averaging as low as 500 millimeters per year on the southernmost coral islands. Because catchment provides most sources of water in Seychelles, yearly variations in rainfall or even brief periods of drought can produce water shortages.” [http://countrystudies.us/seychelles/5.htm]
The following figure shows annual precipitation for Seychelles from the NOAA Global Historical Climate Network (GHCN) database (plotted at http://www.appinsys.com/GlobalWarming/climate.aspx). The recent “drought” (many countries would love to receive > 1600 mm) is not as bad as in the 1930s.
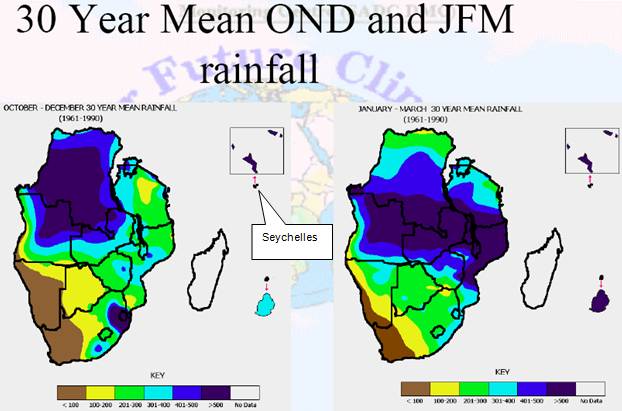
Seychelles is part of the Southern African Development Community. The following figures are from a SADC report [http://www.wamis.org/agm/meetings/wocald06/S4-Garanganga.pdf]. Seychelles is one of the rainiest parts of the area (it is shown below expanded in the box). Note that the high end of the rainfall scale is anything over 500 mm.
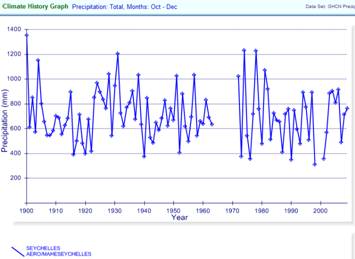
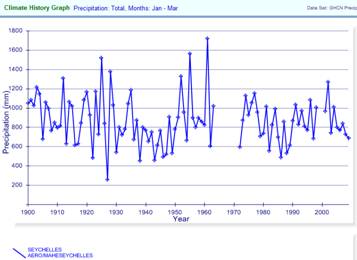
The following figures show Seychelles rainfall for Oct-Dec (right) and Jan-Mar (right). Most of Africa would be happy to get so much rain.
Seychelles’ drought problem – a lack of groundwater and a lack of reservoirs to store rainwater. A 2010 article in the Seychelles Nation Online: “The funny thing is that we get so much rain in Seychelles – a little over two metres of rain falls every year over the main granitic islands. Technically, this should be more than enough to supply us with all the water we need for our homes, and even hotels and other industries. The trouble is, how do we store all this rainwater to use in times of drought? The PUC has a very, very limited reservoir capacity, as we all experience daily. In recent years, our solution has been desalination, but the desalination process uses a lot of energy … we could, at fairly low cost and minimal impact to the environment, build a medium-sized reservoir at Mare Aux Cochons that would alleviate a lot of our problems. Other small reservoirs could be built on some of the larger rivers that don’t dry up during times of drought.” [http://www.nation.sc/index.php?art=21098]
|
|
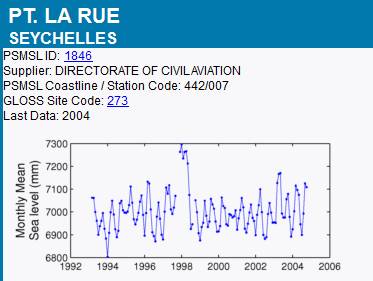
Seychelles Sea Level
The following figure shows sea level data for Pt. La Rue, Seychelles from tide gauge data [http://www.psmsl.org/]
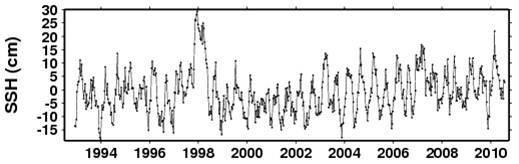
The following figure shows sea level data for Seychelles from satellite data [http://sealevel.colorado.edu/wizard.php]
Sea level rise in Seychelles (0.6 mm / year) is below the global average of 2 mm / year (different source disagree on the global average with ranges of 1.7 to 3.1).
(See: http://www.appinsys.com/GlobalWarming/GW_4CE_SeaLevel.htm for more info on sea levels.)
|
|
Antarctica / Greenland Ice Melt
The main potential for sea level rise due to global warming comes from melting ice in Antarctica and Greenland. Alarmists say this will inundate tropical islands, but the evidence is lacking.
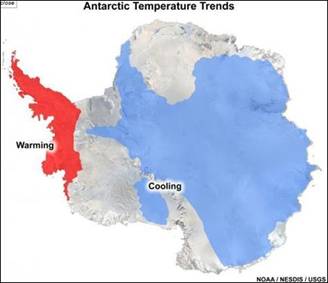
Antarctica
The following figure shows the approximate boundaries of areas that have warmed or cooled over the past 35 years. [http://www.sciencedaily.com/releases/2008/05/080507132855.htm] The mass balance has been increasing. A 2006 paper (Wingham et al, “Mass Balance of the Antarctic Ice Sheet” Royal Society 2006) states: “Mass gains from accumulating snow, particularly on the Antarctic Peninsula and within East Antarctica, exceed the ice dynamic mass loss from West Antarctica. … 72% of the Antarctic ice sheet is gaining 27G29 Gt yrK1, a sink of ocean mass sufficient to lower global sea levels by 0.08 mm / yr” [http://www.cpom.org/research/djw-ptrsa364.pdf]
(See: http://www.appinsys.com/GlobalWarming/RS_Antarctica.htm for more info on Antarctica)
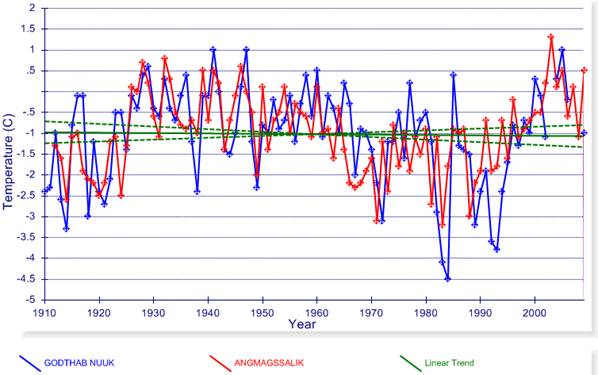
Greenland
There are only two stations in Greenland with long-term data in the NOAA GHCN database – Godthab Nuuk and Angmagssalik. The following figure shows the annual average temperature for the last 100 years (plotted at http://www.appinsys.com/GlobalWarming/climate.aspx). Although there were some “warm” years in the 2000s, there is no warming trend in 100 years of data.
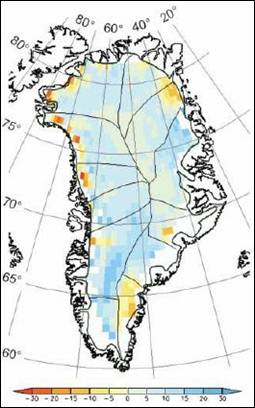
The following figure (left) shows “ice sheet elevation change rate (dH/dt) in cm/year, derived from 11 years of ERS-1/ERS-2 satellite altimeter data, 1992 to 2003. The spatially averaged rate is 5.4 +/- 0.2 cm/year, or 5 cm/year when corrected for isostatic uplift.” [http://www.cfa.harvard.edu/~wsoon/MattCronin-Mar21-07-d/Johannessenetal05-GreenlandIceFinal.pdf] The report also states: “An increase of 6.4 T 0.2 centimeters per year (cm/year) is found in the vast interior areas above 1500 meters”. The decrease at low elevation after 2000 is due to increased adjacent sea surface temperatures.
The above figure (right) shows Greenland melt runoff from a 2006 paper (Box et al: “Greenland Ice Sheet Surface Mass Balance Variability (1988-2004) From Calibrated Polar MM5 Output”, Journal of Climate, Vol. 19, No. 12) [http://polarmet.mps.ohio-state.edu/jbox/pubs/Box_et_al_J_Climate_2006.pdf] The Greenland melting was at least as large in the 1930s-1940s.
(See: http://www.appinsys.com/GlobalWarming/RS_Greenland.htm for more info on Greenland)
With Antarctica having a slight net uptake of water, and Greenland having a only slight contribution to sea level that is no greater than during the 1930s/40s, Jumeau’s claim that sea level will be drowning people in Seychelles is a lie.
|
|
|