Global Warming Science: www.appinsys.com/GlobalWarming
Greenland / Iceland
[last update: 2010/05/22]
|
Cycles
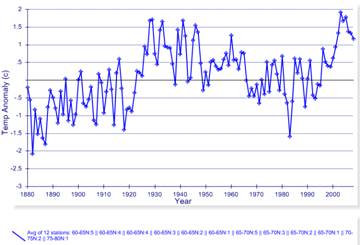
The following figures show average temperature anomalies for 1880 – 2006 (from the Hadley CRUTEM3 database) and then superimposed on the IPCC model plots (from AR4 Fig 9.12) for Greenland / Iceland (pink= models with CO2, blue= models without CO2, black= observed).
The IPCC model plot (above-right) is significant from the following perspectives:
(The temperature anomaly graph (above-left) is graphed using the Hadley CRUTEM3 database used by the IPCC (plotted at: climate history graphing) for 60-80Nx15-55W.)
Recurrent Cycles
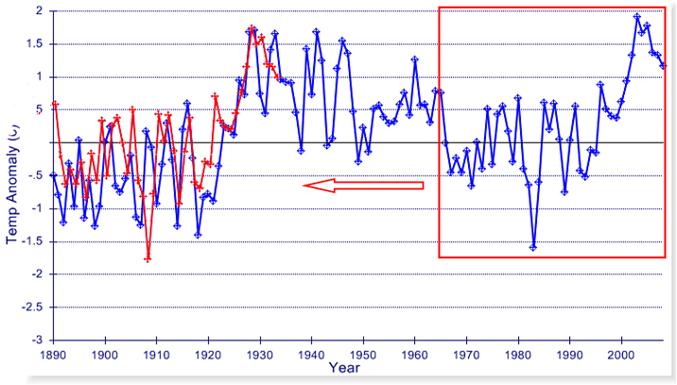
The following figure shows the same temperature anomaly data as above-left (blue). The years bounded by the red rectangle (1965 – 2008) have been copied, changed to red and shifted back 75 years. The pattern shows that it is a recurrent cycle and the net warming has been about 0.1 degree between cycles.
|
|
|
|
Temperatures
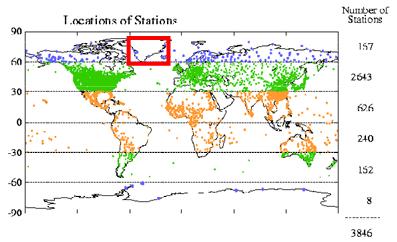
There are very few temperature stations in Greenland / Iceland.
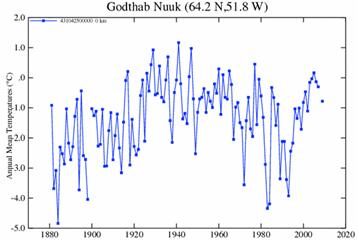
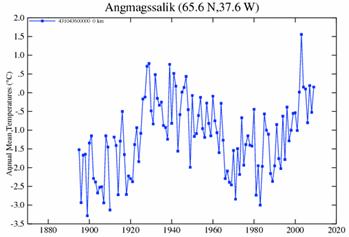
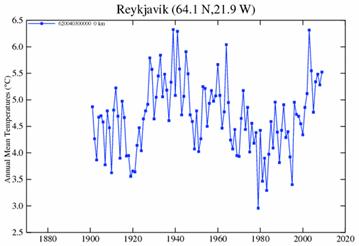
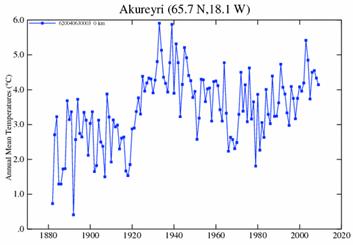
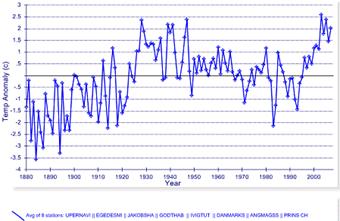
The following are the only stations in the GISS database that have long-term data starting prior to 1930 and continuing to the present (plots show annual mean temperature anomaly data and include 2008 data):
Greenland:
Iceland:
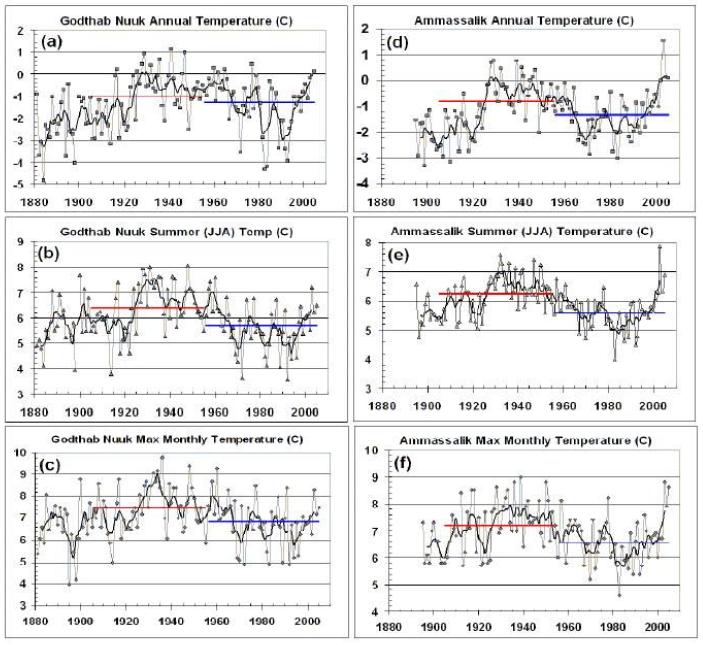
The following temperature trends are from a 2006 paper ( Chylek et al. 2006. “Greenland Warming of 1920-1930 and 1995-2005”, Geophysical Research Letters, 33, 2006) and show three temperature trends for the two Greenland stations that have long term data. [http://www.agu.org/pubs/crossref/2006/2006GL026510.shtml]. The authors state: “Almost all decades between 1915 and 1965 were warmer or at least as warm as the 1995 to 2005 decade…suggesting the current warm Greenland climate is not unprecedented and that similar temperatures were a norm in the first half the 20th century. … no statistically significant difference between the average temperature from the 1905 to the 1955 period and 1955 to 2005 period,” the only difference being that summertime (JJA) average temperatures were warmer at both stations during the 1905-1955 period. Further, although the decade 1920-1930 was as warm as the decade 1995-2005, the rate of warming was “50% higher” during the earlier decade.”
The same paper provided the following conclusions: “Although there has been a considerable temperature increase during the last decade (1995 to 2005) a similar increase and at a faster rate occurred during the early part of the 20th century (1920 to 1930) when carbon dioxide or other greenhouse gases could not be a cause. The Greenland warming of 1920 to 1930 demonstrates that a high concentration of carbon dioxide and other greenhouse gases is not a necessary condition for period of warming to arise. The observed 1995-2005 temperature increase seems to be within a natural variability of Greenland climate. A general increase in solar activity [Scafetta and West, 2006] since 1990s can be a contributing factor as well as the sea surface temperature changes of tropical ocean [Hoerling et al., 2001]… To summarize, we find no direct evidence to support the claims that the Greenland ice sheet is melting due to increased temperature caused by increased atmospheric concentration of carbon dioxide. The rate of warming from 1995 to 2005 was in fact lower than the warming that occurred from 1920 to 1930.”
A 2006 paper studying the temperatures at Arctic Station in Greenland (“Meteorological Trends (1991-2004) at Arctic Station, Central West Greenland (69º15’N) in a 130 years Perspective” by B.U. Hansen, B. Elberling and N. Nielsen: Institute of Geography, University of Copenhagen, Denmark. O. Humlum: Department of Physical Geography, Institute of Geosciences, University of Oslo, Norway.) [http://www.rdgs.dk/image/pub_pdf/artikler/2006_1/GT106_04_Hansen_Elberling_Humlum_Nielsen.pdf] concluded that the present warming is not out of line with past warming occurrences: “It is concluded that climate changes the last decade are dramatic but that similar changes in air temperatures have occurred previous within the last 130 years ... From the above evaluation of fourteen years of meteorological data (1991 – 2004) from Arctic Station on Disko Island (West Greenland) we conclude that markedly changes can be noted, including increasing mean annual air temperatures on the order of 0.4°C per year and 50% decrease in sea ice cover. Changes are mainly noted for the winter period, but also the summer period has been affected as increasing thawing depths and an increase in the growing season. When data are compared to other data series it becomes clear that meteorological observations at Arctic Station are in line with other longer records including data Ilulissat/Jakobshavn, which makes it possible to estimate data from Arctic Station back to 1873. Over this long time period, estimated winter temperatures correlate significantly with NAO and reveal that although the documented climate changes the last decade are dramatic, they are on the same order as changes occurred between 1920 and 1930.”
The following figure is from the above-cited paper providing temperature trends from Arctic Station (solid line) and Ilulissat/Jakobshavn (dotted line) in Greenland.
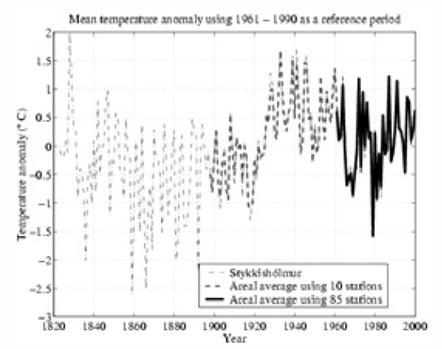
The following figure shows temperature anomalies for Iceland from Stykkisholmur (thin line), areal average obtained using 10 stations that were in operation during all of the 20th century (medium dashed line) and areal average of 85 stations (thick line). [http://amap.no/documents/index.cfm?action=getfile&dirsub=%2FACIA%20International%20Scientific%20Symposium%20on%20Climate%20Change%20in%20the%20Arctic%20-%20Extended%20Abstracts&filename=ACIASymposiumAbstracts-Oral0-3.pdf&CFID=3341130&CFTOKEN=65373972&sort=size]
Another paper from the same 2004 International Symposium on Climate Change in the Arctic as the figure above (“Marine Ecosystem Responses to the Warming of 1920s and 1930s” by K. Drinkwater) stated: “In the 1920s and 1930s there was a dramatic warming of the air and ocean temperatures in the northern North Atlantic ... These high temperatures match, and in some cases exceed, the present day warming. … The most well documented change was the increase in abundance of Atlantic cod off West Greenland … The increased cod abundance led to the development of a large cod fishery … Prior to the warming in the 1920s, the Atlantic cod spawned almost exclusively off the south coast of Iceland. As the waters warmed, cod spawning spread northward until there were major spawning locations completely surrounding Iceland”. The paper is interesting since the warming resulted in positive effects of increased fisheries throughout the Arctic and North Atlantic.
In a 2005 paper studying the Helheim glacier in Greenland (“Rapid Retreat and Acceleration of Helheim Glacier, East Greenland”, by I.M. Howat, Department of Earth Sciences, University of California, Santa Cruz, California, I. Joughin, Applied Physics Lab, University of Washington, Seattle, S. Tulaczyk, Department of Earth Sciences, University of California, Santa Cruz, S. Gogineni, Center for Remote Sensing of Ice Sheets, University of Kansas, Geophysical Research Letters, 2005), the authors worry about the entire Greenland ice sheet disappearing due to increased melting of the glacier. However it does not address long-term temperatures or melting. One of the paper authors (Howat) said in 2007: [ http://tierneylab.blogs.nytimes.com/2007/02/08/greenlands-glaciers-take-a-breather/ ] “Greenland was about as warm or warmer in the 1930’s and 40’s, and many of the glaciers were smaller than they are now. This was a period of rapid glacier shrinkage world-wide, followed by at least partial re-expansion during a colder period from the 1950’s to the 1980’s. Of course, we don’t know very much about how the glacier dynamics changed then because we didn’t have satellites to observe it. However, it does suggest that large variations in ice sheet dynamics can occur from natural climate variability.”
A 2004 paper (“Global Warming and the Greenland Ice Sheet”, P. Chylek, J. Box and G. Lesins, Space and Remote Sensing Sciences, Los Alamos National Laboratory; Department of Physics, New Mexico State University; Department of Physics and Atmospheric Science, Dalhousie University, Climatic Change 2004) [http://www.ingentaconnect.com/content/klu/clim/2004/00000063/F0020001/05140445#aff_1] provides the following conclusions: “The Greenland coastal temperatures have followed the early 20th century global warming trend. Since 1940, however, the Greenland coastal stations data have undergone predominantly a cooling trend. At the summit of the Greenland ice sheet the summer average temperature has decreased at the rate of 2.2 C per decade since the beginning of the measurements in 1987. This suggests that the Greenland ice sheet and coastal regions are not following the current global warming trend. A considerable and rapid warming over all of coastal Greenland occurred in the 1920s when the average annual surface air temperature rose between 2 and 4 C in less than ten years (at some stations the increase in winter temperature was as high as 6 C). This rapid warming, at a time when the change in anthropogenic production of greenhouse gases was well below the current level, suggests a high natural variability in the regional climate.”
A 2009 paper (“Greenland Ice Sheet Surface Air Temperature Variability: 1840-2007”, Box, Yang, Bromwich and Bai, American Meteorological Society Journal Vol 22:14, July 2009 [http://journals.ametsoc.org/doi/abs/10.1175/2009JCLI2816.1] states: “Year 2003 was the only year of 1840–2007 with a warm anomaly that exceeds three standard deviations from the 1951–80 base period. The annual whole ice sheet 1919–32 warming trend is 33% greater in magnitude than the 1994–2007 warming.”
|
|
Greenland Ice Sheet / Glaciers
A paper by Jason Box et al (Box, J.E., D.H. Bromwich, B.A. Veenhuis, L-S Bai, J.C. Stroeve, J.C. Rogers, K. Steffen, T. Haran, S-H Wang, “Greenland Ice Sheet Surface Mass Balance Variability (1988-2004) From Calibrated Polar MM5 Output”, Journal of Climate, Vol. 19, No. 12) [http://polarmet.mps.ohio-state.edu/jbox/pubs/Box_et_al_J_Climate_2006.pdf] states “The combined effect of temperature and precipitation trends over the 17-yr lead to increased rates of ablation and increased accumulation (Fig. 10b). The net effect of these competing factors demonstrates that the overall (total ice sheet) surface mass balance change is relatively small”.
The following figures show the 17-year change in average annual surface mass balance for the Greenland ice sheet (Figure 10b referred to above) and the reconstructed runoff from the ice sheet from 1860 – 2004.
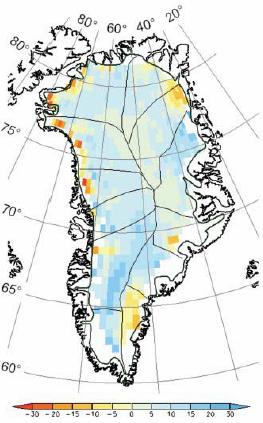
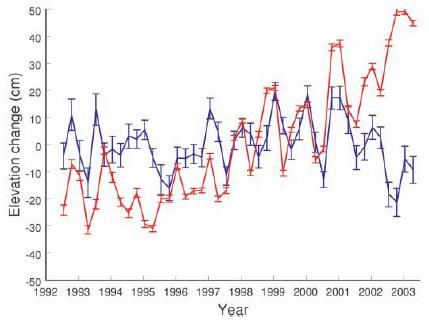
The following figure (left) shows “icesheet elevation change rate (dH/dt) in cm/year, derived from 11 years of ERS-1/ERS-2 satellite altimeter data, 1992 to 2003. The spatially averaged rate is 5.4 +/- 0.2 cm/year, or 5 cm/year when corrected for isostatic uplift.” The figure below-right shows “spatially averaged Greenland Ice Sheet elevation, shown as anomalies from the 11-year mean, 1992 to 2003. The data are aggregated into areas 91500 m elevation (red) and G1500 m (blue)” [http://www.cfa.harvard.edu/~wsoon/MattCronin-Mar21-07-d/Johannessenetal05-GreenlandIceFinal.pdf] The report also states: “An increase of 6.4 T 0.2 centimeters per year (cm/year) is found in the vast interior areas above 1500 meters”. The decrease at low elevation after 2000 is due to increased adjacent sea surface temperatures.
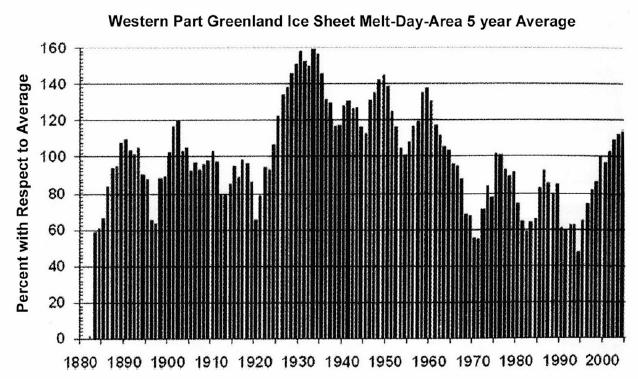
The following figure shows western Greenland ice sheet melt from Chylek 2007 as reported by Akasofu who states: “present changes of the Greenland ice sheet are smaller than changes observed during the 1920– 1940 period” [http://people.iarc.uaf.edu/~sakasofu/pdf/two_natural_components_recent_climate_change.pdf]
A 2008 study of the Jakobshavn outlet glacier by an international group of researchers, “Acceleration of Jakobshavn Isbræ Triggered by Warm Subsurface Ocean Waters” (Holland, Thomas, Young, Ribergaard, Lyberth) [http://www.nature.com/ngeo/journal/v1/n10/abs/ngeo316.html] states: “Here we present hydrographic data that show a sudden increase in subsurface ocean temperature in 1997 along the entire west coast of Greenland, suggesting that the changes in Jakobshavn Isbræ were instead triggered by the arrival of relatively warm water originating from the Irminger Sea near Iceland.”
The Jakobshavn Glacier has been retreating since observations began being recorded in the 1800s. The following figure shows the retreat of the glacier since before 1850. Since the IPCC indicates CO2 warming has only occurred since 1970, the previous 150 years of glacier retreat must be caused by something else. [http://www.ametsoc.org/atmospolicy/documents/Thompson%20Senate307.pdf]
An international team of scientists from Norway’s Nansen Environmental and Remote Sensing Center (NERSC), Mohn-Sverdrup Center for Global Ocean Studies and Operational Oceanography and the Bjerknes Centre for Climate Research, Russia’s Nansen International Environmental and Remote Sensing Center and the United States’ Environmental Systems Analysis Research Center 1992 to 2003 analyzed data from radar altimeters on ESA’s ERS satellites to determine thickness changes in the Greenland Ice Sheet. They found a net increase of 6.4 centimeters (2.5 inches) per year in the interior area above 1500 meters (4921 feet) elevation. Below that altitude, the elevation-change rate is minus 2.0 centimeters (0.8 inch) per year, broadly matching reported thinning in the ice-sheet margins. [http://earthobservatory.nasa.gov/Newsroom/MediaAlerts/2005/2005110420860.html]
A study of organic remains recently exposed by a receding glacier in Greenland (“Organic Remains from the Istorvet Ice Cap, Liverpool Land, East Greenland: A Record of Late Holocene Climate Change” by Lowell, T V, Kelly, M A, Hall, B., Smith, C A, Garhart, K, Travis, S, and Denton, G H, American Geophysical Union, 2007 Fall Meeting) performed radiocarbon dating of emergent organic remains along the western margin of the Istorvet ice cap. The study found ”the largest concentration [of radiocarbon dates] from A.D. 800 to 1014… Both the ice cap geometry and the presence of overrun organic remains indicate past temperatures at least as warm as those at present.” [http://www.agu.org/cgi-bin/SFgate/SFgate?&listenv=table&multiple=1&range=1&directget=1&application=fm07&database=%2Fdata%2Fepubs%2Fwais%2Findexes%2Ffm07%2Ffm07&maxhits=200&=%22C13A-04%22 ]
|
|
Sea Ice
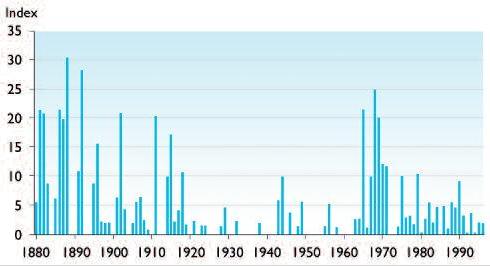
The following figure shows the Icelandic sea ice index [http://www.eoearth.org/article/Sea_ice_in_the_Arctic].
Annual values of the Icelandic sea-ice index
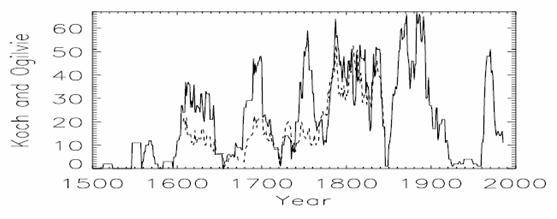
The following figure shows the Icelandic sea ice index from a 2005 report by the Danish Meteorological Institute (“Multi-decadal variation of the East Greenland Sea-Ice Extent: AD 1500-2000”) [http://www.dmi.dk/dmi/sr05-02.pdf].
East Greenland / Iceland Sea Ice Index
It is clear that recent sea ice declines are not unprecedented.
|
|
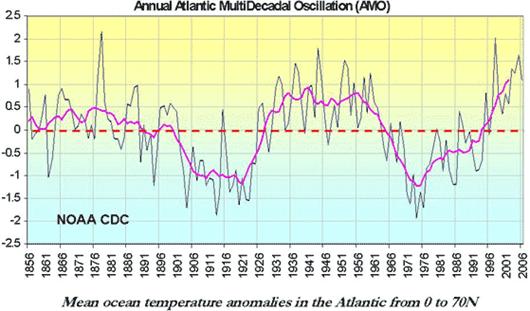
Atlantic Multidecadal Oscillation (AMO)
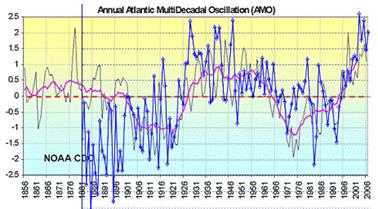
The Atlantic Multi-Decadal Oscillation (AMO) is a fluctuation in de-trended sea surface temperatures in the North Atlantic Ocean. It was identified in 2000 and the AMO index was defined in 2001 as the 10-year running mean of the detrended Atlantic SST anomalies north of the equator. The AMO has a cycle length of approximately 70 years (i.e. a warm phase plus a cold phase). The following figure shows the annual AMO from 1858 to 2006 [http://intellicast.com/Community/Content.aspx?a=127] (See this link for more description of the AMO).
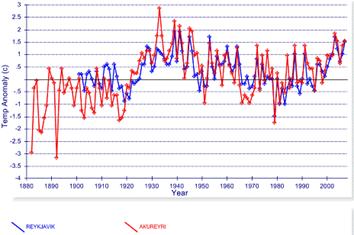
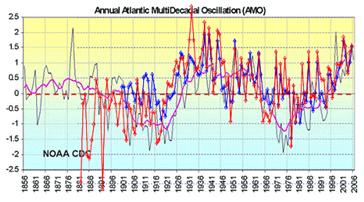
The AMO affects regional temperatures in the Arctic area of the northern Atlantic. The following figure (left) shows the temperature anomalies for the only 2 long-term stations in Iceland (from the NOAA GHCN database). The right-hand figure compares the Iceland temperatures with the AMO shown above. There is a strong correlation between the two.
The following figure shows the temperature anomalies for the available long-term or recent stations in Greenland (from the NOAA GHCN database).
The next figure (left) shows the average temperature anomalies from those same stations (shown above), while the right-hand figure compares the average temperature anomalies with the AMO shown previously. Again, there is a strong correlation between the two.
See http://www.appinsys.com/GlobalWarming/PDO_AMO.htm#amo for more information on the AMO.
|
|
CO2 or Solar
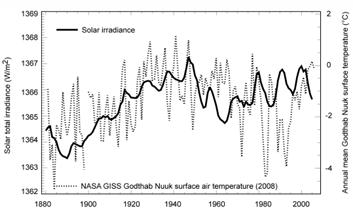
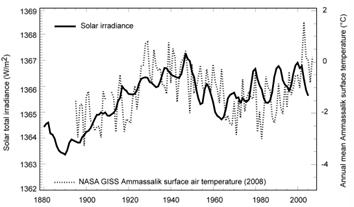
A 2005 study of the effects of solar irradiance on Arctic temperatures (Soon, W.H., "Variable Solar Irradiance as a Plausible Agent for Multidecadal Variations in the Arctic-wide Surface Air Temperature Record of the Past 130 Years," Geophysical Research Letters, Vol. 32, 2005 [http://www.agu.org/pubs/crossref/2005/2005GL023429.shtml] showed that there is a much stronger correlation between temperatures and solar irradiance than with CO2, as shown in the following figures.
The following figures compare the annual mean estimates of total solar irradiance (solid line) compared with the surface temperature records from two coastal Greenland stations: Godthab Nuuk (dotted curve; left) and Ammassalik (dotted curve; right) from about 1881 to 2007 [http://www.cfa.harvard.edu/~wsoon/SunClimate09-d/Soon09-June4-PGEO_30n02_144-184-Soon.pdf]
|
|
Long Term Data
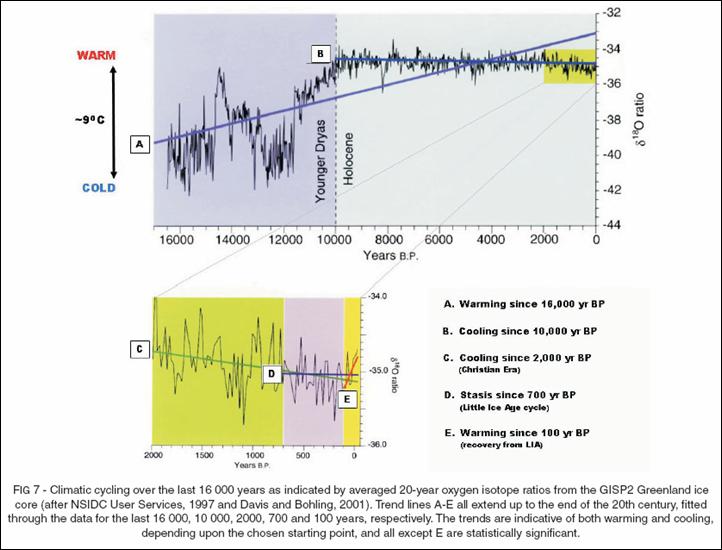
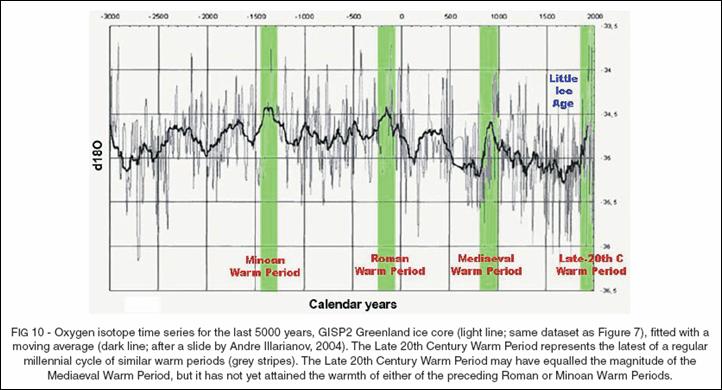
The following figure shows long-term Greenland temperatures derived from ice core oxygen isotopes [http://icecap.us/images/uploads/200705-03AusIMMcorrected.pdf]. Over the last 2000 years there has been slight cooling, with the 20th century fluctuations within the standard trend. The next figure (from the same reference) shows more detail of the ice core data for the past 5000 years.
|
|
Interactive data sites pertaining to Greenland:
Greenland coastal satellite images: http://ocean.dmi.dk/arctic/modis.uk.php
|