Global Warming Science - www.appinsys.com/GlobalWarming
Climatic Events – Hurricanes
[last update: 2011/03/02]
While the global warming scare got rolling, other climatic events such as receding glaciers have also garnered much alarmist attention.
Hurricanes are the focus of this document.
Other documents in Climatic Events include:
- Precipitation (including Tornadoes)
- Polar Ice Caps
- Glaciers
- Sea Level
- Animals (including Polar Bears)
- Human Disease / Death (including Malaria and Extreme Weather)
- North Atlantic Thermohaline Circulation / Gulf Stream
|
|
Hurricanes
|
Contradictory predictions have been reported in the media about the effect of global warming on hurricanes. However, most hurricane experts as well as the data, indicate that there is no link to anthropogenic CO2. The National Oceanic and Atmospheric Administration (NOAA) attributes increased recent hurricane activity to “natural occurring cycles in tropical climate patterns near the equator. These cycles, called “the tropical multi-decadal signal,” typically last several decades (20 to 30 years or even longer). As a result, the North Atlantic experiences alternating decades long (20 to 30 year periods or even longer) of above normal or below normal hurricane seasons. NOAA research shows that the tropical multi-decadal signal is causing the increased Atlantic hurricane activity since 1995, and is not related to greenhouse warming.” [http://www.magazine.noaa.gov/stories/mag184.htm]
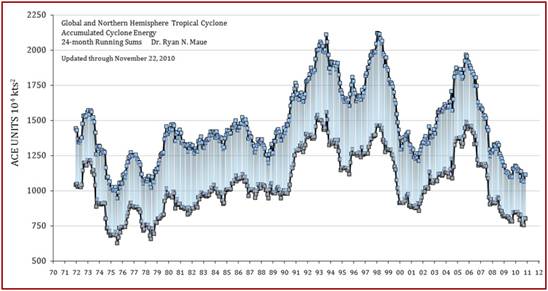
As of November 2010: “Global and Northern Hemisphere ACE remains at the lowest levels since the Pacific Climate Shift of 1977.”
[http://www.coaps.fsu.edu/~maue/tropical/]
[http://www.coaps.fsu.edu/~maue/tropical/]
|
|
Hurricane Frequency
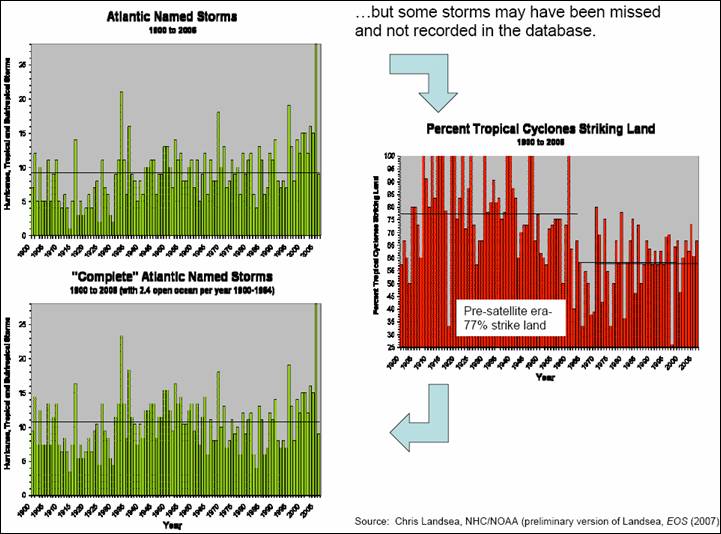
There is a historical problem with hurricane measurement due to the fact that in the early 1900s, only hurricanes striking land or observed from surviving boats were seen and named. Starting in the mid-20th century, major hurricanes spotted from planes were counted and named. Since the satellite era, all hurricanes are spotted, counted and named regardless of size or duration.
A 2009 paper by NOAA scientists Landsea et al [http://ams.allenpress.com/perlserv/?request=get-abstract&doi=10.1175%2F2009JCLI3034.1] found that the increased number of hurricanes in the 20th century was due to improved observational techniques developed during the century (i.e. planes and satellites) The abstract states: “the increase arises primarily from improvements in the quantity and quality of observations, along with enhanced interpretation techniques, which have allowed National Hurricane Center forecasters to better monitor and detect initial TC formation, and thus incorporate increasing numbers of very short-lived systems into the TC database”
The following figure shows the Atlantic named storms (upper left). The chart on the right (red) shows the percent striking land before and after the satellite era – evidence of the number of storms not counted in the earlier era since they did not strike land. The chart in the lower left shows the adjusted count. [http://www.waveworkshop.org/10thWaves/Presentations/L1.Knutson_Hawaii_waves_nov07.pdf]
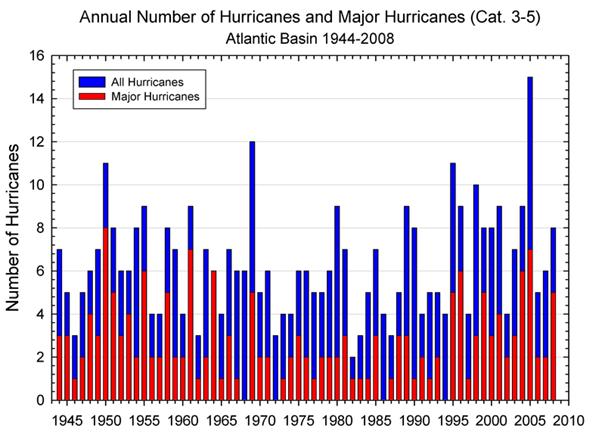
The following figure shows the annual number of hurricanes since 1944 [http://www.ncdc.noaa.gov/oa/climate/research/hurricane-climatology.html]
“Between 1966 and 2003, US major hurricane landfall numbers were below the long-term average”. “Although global surface temperatures have increased over the last century and over the last 30 years, there is no reliable data available to indicate increased hurricane frequency or intensity in any of the globe’s seven tropical cyclone basins. Meteorologists who study tropical cyclones have no valid physical theory as to why hurricane frequency or intensity would necessarily be altered significantly by small amounts (< +/-1C) of global mean temperature change.” [Extended Range Forecast of Atlantic Seasonal Hurricane Activity and U.S. Landfall Strike Probability for 2007, Klotzbach and Gray, Colorado State University, Dec. 2006 http://typhoon.atmos.colostate.edu/Forecasts/2006/dec2006/].
A 2007 study of the impact of global warming on hurricanes done at the University of Miami and reported in Science Daily (Global Warming Increases Wind Shear, Reduces Hurricanes, Climate Model Shows) [http://www.sciencedaily.com/releases/2007/04/070417182843.htm ] says “Climate model simulations for the 21st century indicate a robust increase in wind shear in the tropical Atlantic due to global warming, which may inhibit hurricane development and intensification. Historically, increased wind shear has been associated with reduced hurricane activity and intensity”.
The National Oceanic and Atmospheric Administration (NOAA) made the following statement in December 2006 [http://hurricanes.noaa.gov/pdf/hurricanes-and-climate-change-09-2006.pdf]:“Atlantic hurricane seasons since 1995 have been significantly more active, e.g. more hurricanes and more intense hurricanes, than the previous two decades [however] earlier periods, such as from 1945 to 1970 (and perhaps earlier), were apparently as active as the most recent decade.... The past decade has seen increased U.S. landfalls, however periods of even higher landfalls occurred early in the century.” In February 2008, a NOAA press release [http://www.noaanews.noaa.gov/stories2008/20080222_hurricane.html] stated: “There is nothing in the U.S. hurricane damage record that indicates global warming has caused a significant increase in destruction along our coasts”.
According to William Gray (Professor Emeritus of Atmospheric Science, Department of Atmospheric Science, Colorado State University) in a paper called Hurricanes and Climate Change (Oct. 2006) [http://ff.org/centers/csspp/pdf/20061011_gray.pdf] “The most reliable long-period hurricane records we have are the measurements of US landfalling tropical cyclones since 1900 (Table 3). Although global mean ocean and Atlantic surface temperatures have increased by about 0.4oC between these two 50-year periods (1900-1949 compared with 1956-2005), the frequency of US landfall numbers actually shows a slight downward trend for the later period. If we chose to make a similar comparison between US landfall from the earlier 30-year period of 1900-1929 when global mean surface temperatures were estimated to be about 0.5oC colder than they have been the last 30 years (1976-2005), we find exactly the same US hurricane landfall numbers (54 to 54) and major hurricane landfall numbers (21 to 21).”
Recent research reported in 2007 by the Woods Hole Oceanic Institute “Scientists Unearth Long Record of Past Hurricanes” [http://www.whoi.edu/oceanus/viewArticle.do?id=28207§ionid=1021] analyzing soil deposits representing the last 5,000 years in Puerto Rico found: “extensive periods of intense hurricanes in the past, when ocean temperatures were cooler than they are now. The record showed that the dominant forces spawning heightened hurricane activity appeared to be atmospheric conditions generated by weak El Niños in the tropical Pacific and strong West African monsoons”
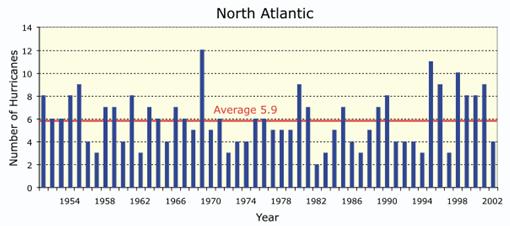
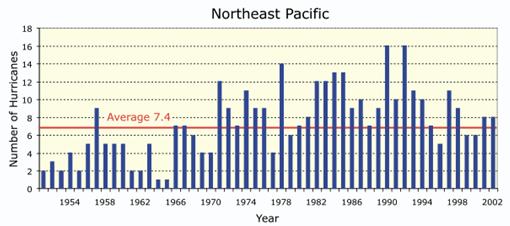
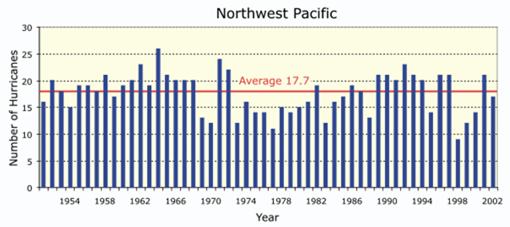
The following figure shows annual number of hurricanes for the North Atlantic, Northeast Pacific and Northwest Pacific for 1950 - 2002. The North Atlantic and Northeast Pacific tend to have opposite trends. [http://www.physicalgeography.net/fundamentals/7u.html]
A paper by Landsea et al -- “Downward trends in the frequency of intense Atlantic hurricanes during the past five decades“ -- Geophysical Research Letters, 1996 – by Christopher W. Landsea 1 and Neville Nicholls (Bureau of Meteorology Research Centre, Melbourne, Victoria Australia), William M. Gray, Department of Atmospheric Science, Colorado State Universit)y and Lixion A. Avila (National Hurricane Center, Miami) [http://www.aoml.noaa.gov/hrd/Landsea/downward/index.html] – states “contrary to many expectations that globally tropical cyclones may be becoming more frequent and/or more intense due to increasing concentrations of greenhouse gases, regionally the Atlantic basin has in recent decades seen a significant trend of fewer intense hurricanes and weaker cyclones overall. In addition, the maximum intensity reached in each year has shown no appreciable change.” The following figure is from this paper.
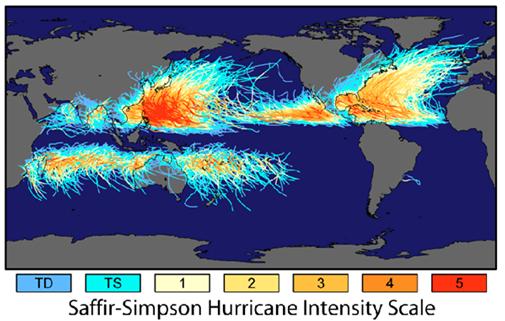
The following figure shows the occurrence of hurricanes and their tracks from the beginning of records to 2006 [http://www.physicalgeography.net/fundamentals/7u.html]
|
|
Accumulated Cyclone Energy (ACE)
The most common method of measuring overall hurricane significance is in terms of the Accumulated Cyclone Energy (ACE). ACE combines wind speed and duration of cyclones to determine accumulated energy.
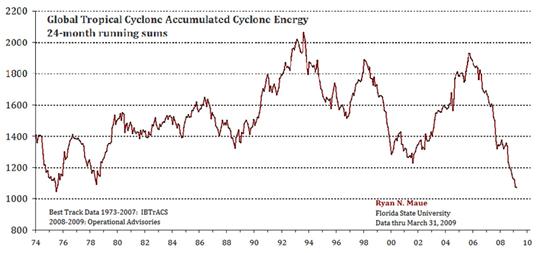
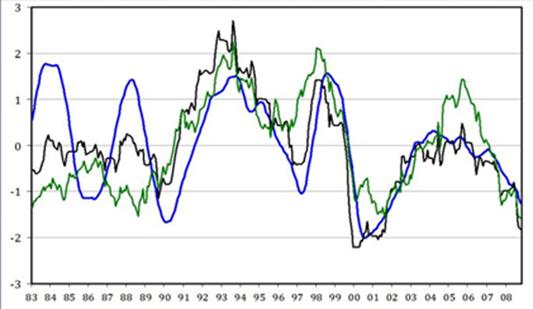
The following figures show: (upper) the global ACE for 1974-2009 (lower) the Pacific ACE (green), global ACE (black) and multivariate ENSO (blue) 1983 - 2008. [http://www.coaps.fsu.edu/~maue/tropical/ams_maue_2009.jpg]
Pacific ACE (green), global ACE (black) and multivariate ENSO (blue) 1983 – 2008
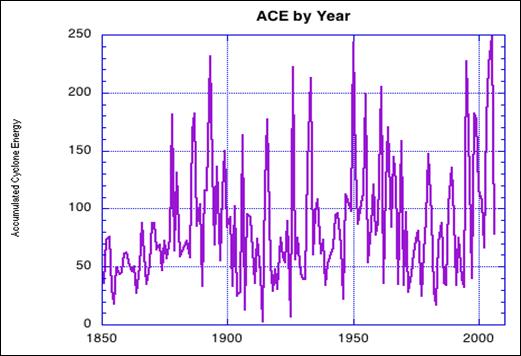
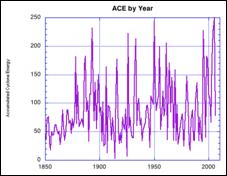
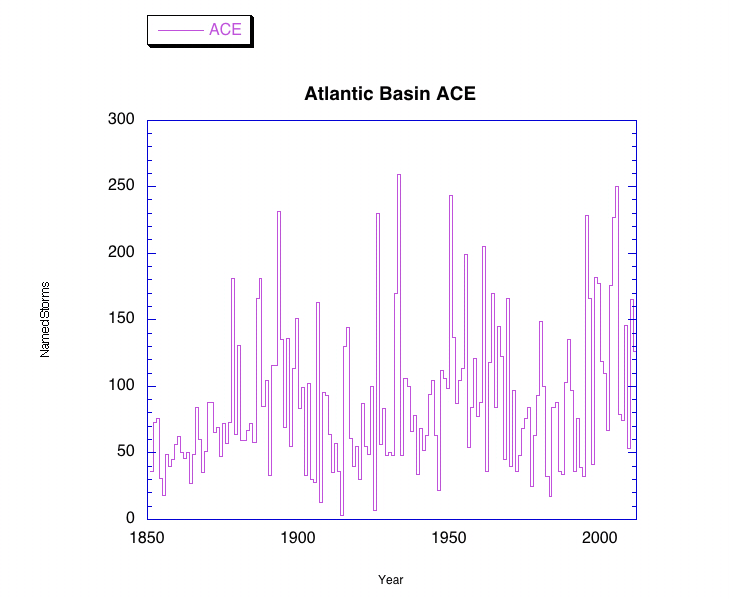
The following figure shows the Atlantic Basic accumulated cyclone energy (ACE) since 1850 [http://www.aoml.noaa.gov/hrd/tcfaq/ACE.jpg] showing an approximately 55-year cycle.
Atlantic ACE Since 1850
The following figures show North Atlantic hurricanes in terms of ACE for 1949-2007 [http://www.ncdc.noaa.gov/oa/climate/research/2007/ann/us-summary.html]
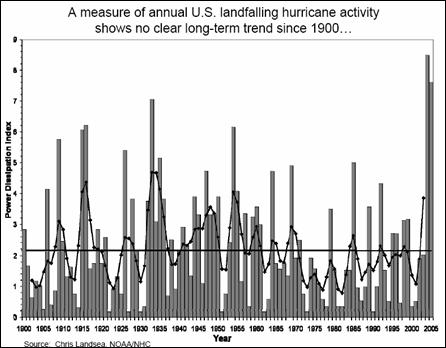
The following figure shows the US landfalling hurricanes in terms of the Power Dissipation Index (PDI) for 1900-2006 [http://www.waveworkshop.org/10thWaves/Presentations/L1.Knutson_Hawaii_waves_nov07.pdf]
A paper called “Annual Analyses of Basin and Hemispheric Tropical Cyclone Indices” by Levinson, Lawrimore, Gleason and Wallis (NOAA/NESDIS National Climatic Data Center, Asheville, North Carolina), 2006 [ftp://ftp.ncdc.noaa.gov/pub/data/papers/2006dlproc2c.4free.pdf] analyzed the occurrence of hurricanes / cyclones in the various global basins. The following figure shows annual values of ACE calculated for each of the seven global tropical cyclone basins showing no trend in ACE (the red lines denote the 1981-2000 base period means for each basin).
Worldwide Regional Trends In Accumulated Cyclone Energy (ACE) Index
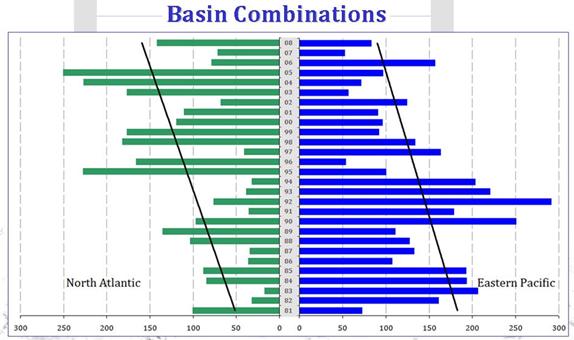
One observation from the above figure: the Atlantic and East Pacific trends are complementary in nature – as one increases, the other decreases. The following figure aligns these two basins illustrating the complementary nature [http://www.coaps.fsu.edu/~maue/tropical/ams_maue_2009.jpg].
|
|
Relationship to Oceanic Oscillations
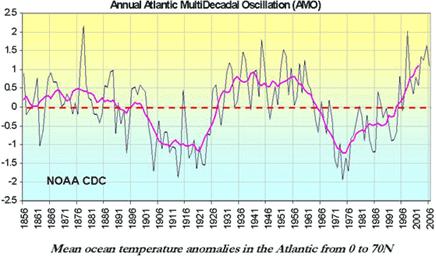
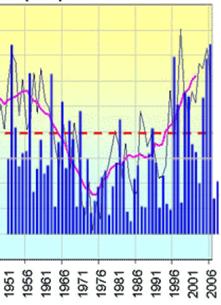
The following figure shows a plot of the Atlantic Multidecadal Oscillation (AMO), along with the North Atlantic ACE superimposed on the AMO plot. The next figure shows the AMO superimposed on the PDI plot from above. The correlation of hurricanes with the AMO is clear. (See www.appinsys.com/GlobalWarming/PDO_AMO.htm for details about the AMO)
In their 2008 hurricane summary (“Summary of 2008 Atlantic Tropical Cyclone Activity and Verification of Author’s Seasonal and Monthly Forecasts”, Philip J. Klotzbach and William M. Gray, Department of Atmospheric Science Colorado State University, Nov. 2008) the authors state: “Despite the global warming of the sea surface that has taken place over the last 3 decades, the global numbers of hurricanes and their intensity have not shown increases in recent years except for the Atlantic. This large increase in Atlantic major hurricanes is primarily a result of the multi-decadal increase in the Atlantic Ocean thermohaline circulation (THC) that is not directly related to global sea surface temperatures or CO2 gas increases. Changes in ocean salinity are believed to be the driving mechanism. These multi-decadal changes have also been termed the Atlantic Multidecadal Oscillation (AMO).” [http://tropical.atmos.colostate.edu/Forecasts/2008/nov2008/nov2008.pdf]
The following figure shows the AMO from 1850 to 2008 [http://en.wikipedia.org/wiki/File:Amo_timeseries_1856-present.svg]. The next figure superimposes the Atlantic Basin ACE (right - shown previously from [http://www.aoml.noaa.gov/hrd/tcfaq/ACE.jpg]) on the AMO, illustrating the strong correlation.
The following figure shows the adjusted annual hurricane count with the AMO superimposed (magenta line). The adjusted count is from: [http://www.waveworkshop.org/10thWaves/Presentations/L1.Knutson_Hawaii_waves_nov07.pdf].
|
|
US Landfalling Hurricanes
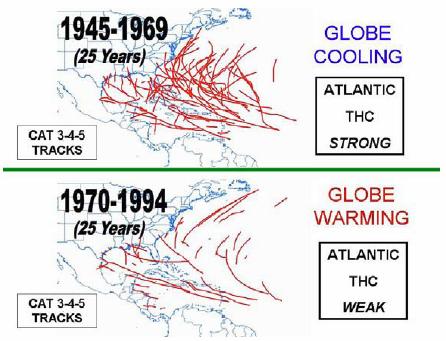
The following figure is from the previously mentioned Klotzback / Gray study and shows tracks of major (Category 3-4-5) hurricanes during the 25-year cooling period of 1945-1969 versus the 25-year warming period of 1970-1994. They state: “CO2 amounts in the later period were approximately 18 percent higher than in the earlier period. Major Atlantic hurricane activity was less than 1/2 as frequent during the latter period despite warmer global temperatures.”
Tracks of major (Category 3-4-5) hurricanes during the 25-year cooling period of 1945-1969 versus the 25-year warming period of 1970-1994
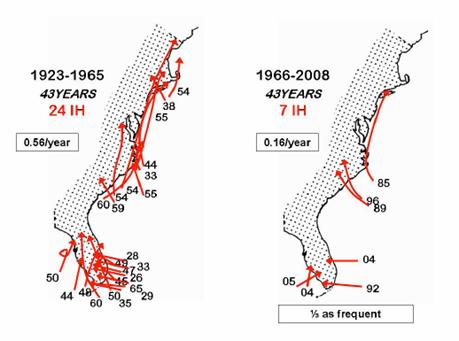
The next figure (from the same study) shows tracks of East Coast and Florida Peninsula major landfalling hurricanes during the 43-year period of 1923-1965 versus the most recent 43-year period of 1966-2008. The authors state: “Although 2005 had a record number of tropical cyclones (28 named storms, 15 hurricanes and 7 major hurricanes), this should not be taken as an indication of something beyond natural processes. There have been several other years with comparable hurricane activity to 2005. For instance, 1933 had 21 named storms in a year when there was no satellite or aircraft data. Records of 1933 show all 21 named storm had tracks west of 60W where surface observations were more plentiful. If we eliminate all the named storms of 2005 whose tracks were entirely east of 60W and therefore may have been missed given the technology available in 1933, we reduce the 2005 named storm total by seven (to 21) – the same number as was observed to occur in 1933.”
Tracks of East Coast and Florida Peninsula major landfalling hurricanes during the 43-year period of 1923-1965 versus the most recent 43-year period of 1966-2008.
|
|
Indian Ocean Cyclones
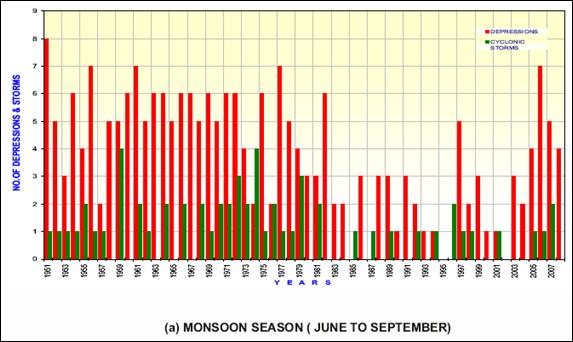
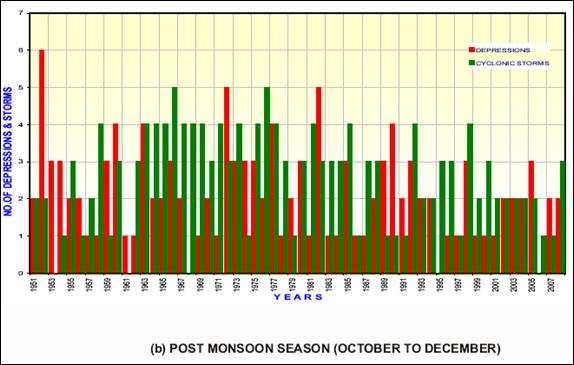
The following figures show the occurrence of depressions and cyclones/storms in the Indian Ocean [http://www.imdpune.gov.in/research/ncc/climatebulletin/annual%20summary%202008.pdf] There is a decreasing trend during the “global warming era”.
|
|
Australian Tropical Cyclones
The total number of tropical cyclones in the Australia region has been decreasing during the “warming era”, as shown in the following figure. [http://www.bom.gov.au/cyclone/climatology/trends.shtml] This source also states: “Since that time [2001] there has been a growing number of studies that indicate a consistent signal of fewer tropical cyclones globally in a warmer climate“. (Although, as usual, a problem with climate models: “there is large uncertainty in the future change in tropical cyclone frequency projected by climate models” and “the highest resolution models show evidence of an increase in tropical cyclone intensity in a warmer world”, contrary to the data).
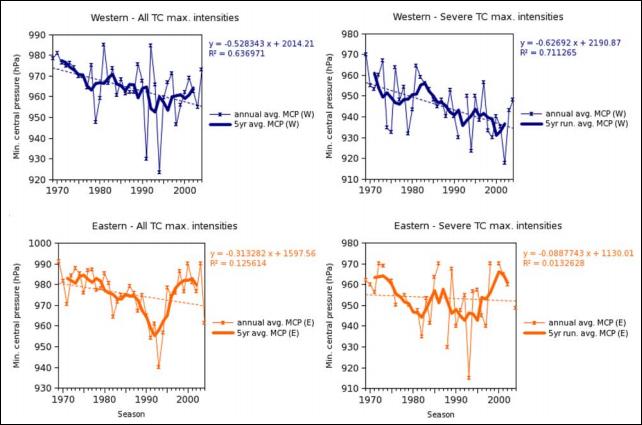
The following figures show tropical cyclone (TC) maximum intensity by region (top: Western Australia, bottom: Eastern Australia) and for all TC (left) and sever TC (right). [http://www.earthbyte.org/people/patrice/Teaching/Geos-2111GIS/Ref/Hassim-G3-08-OZCyclone.pdf] “both sectors show statistically significant, long-term downward trends in average MCP”
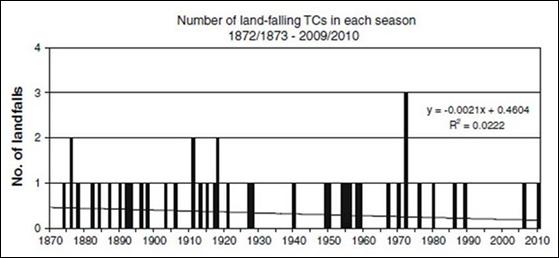
A 2010 paper (Callaghan and Power, “Variability and decline in the number of severe tropical cyclones making land-fall over eastern Australia since the late nineteenth century”, Climate Dynamics), states: “The linear trend in the number of severe TCs making land-fall over eastern Australia declined from about 0.45 TCs/year in the early 1870s to about 0.17 TCs/year in recent times—a 62% decline. This decline can be partially explained by a weakening of the Walker Circulation, and a natural shift towards a more El Niño-dominated era. The extent to which global warming might be also be partially responsible for the decline in land-falls—if it is at all—is unknown.” [http://www.springerlink.com/content/b073428q37741816/] The following figure is from their paper.
|
|
Updated info on Hurricanes
http://www.coaps.fsu.edu/~maue/tropical/
|
|
|
