Global Warming Science - www.appinsys.com/GlobalWarming
Antarctic Peninsula / West Antarctica Region
[last update: 2009/04/18]
While a warming trend is absent throughout most of Antarctica (see www.appinsys.com/GlobalWarming/RS_Antarctica.htm), the Antarctica Peninsula has shown warming. The following figure shows historical temperature trends for stations on the Antarctic Peninsula.
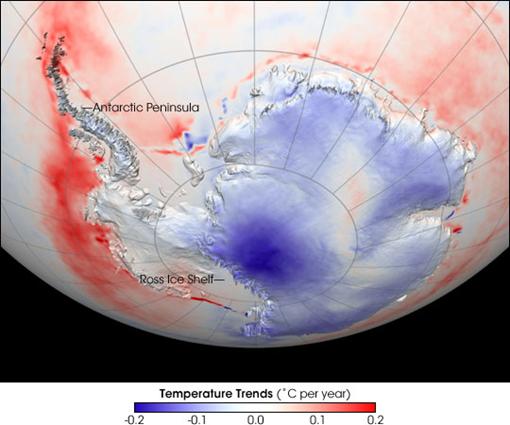
The NASA website [http://earthobservatory.nasa.gov/Newsroom/NewImages/images.php3?img_id=17257] provides the following image from satellite infrared imaging, showing Antarctic temperature trend for 1982-2004. The image shows trends in “skin temperatures” - temperatures from roughly the top millimeter of the land or sea surface—not air temperatures. Some of the smaller near-shore red spots are due to a change from ice to water, thus creating a skin-temperature increase since the type of “skin” has changed. However, around the tip of the Antarctic Peninsula and just offshore from West Antarctica, the sea surface temperatures show an increase.
The Antarctic Peninsula / West Antarctica Region is distinct from the larger East Antarctica. West Antarctica is volcanically active, whereas East Antarctica is quite stable. The Transantarctic Mountains provide the defining line between the two parts. According to “The Lithospheric Setting of the West Antarctic Ice Sheet” by Dalziel and Lawver (Antarctic Research Series Vol. 77, American Geophysical Union, 2001 [http://pangea.stanford.edu/research/Oceans/GES206/readings/Dalziel%20&%20Lawver%202001.pdf]): “Antarctica consists of two geologically distinct provinces, a Precambrian craton in the eastern hemisphere, and a younger series of mobile belts south of the Pacific Ocean. Unlike its land-based counterpart covering the East Antarctic craton, the base of the West Antarctic Ice Sheet (WAIS) is largely below sea level in the Ross and Weddell embayments. … West Antarctica has been part of the tectonically active mobile belt generally known as the circum-Pacific “ring of fire”, the zone of plate convergence. … Ongoing fracturing, volcanic activity and bordering uplift associated with the development of the rift system combine to modify the predominantly sub-sea level lithospheric cradle of the unique marine-based WAIS. … The geochemistry of the bimodal volcanic rocks indicates impingement of a mantle plume beneath the nearly stationary Antarctic continental lithosphere as the likely cause of both uplift and volcanism.”
The following figure is from the above-mentioned paper. The red triangles mark the locations of active and recently active volcanoes.
The British Antarctic Survey’s volcano page [http://www.antarctica.ac.uk/about_antarctica/geography/rock/volcanoes.php] states: “The Antarctic region includes amongst the world's best examples of a long-lived continental margin arc (Antarctic Peninsula), a very young marginal basin (Bransfield Strait) and an oceanic island arc (South Sandwich Islands).”
The following image identifies the above-mentioned features. This image is from a paper called “Long-Term Monitoring of Deep Ocean Hydrothermal Ecosystems” [http://www.esf.org/fileadmin/be_user/research_areas/social_sciences/documents/Long-term_monitoring_of_deep-ocean_hydrothermal_ecosystem.pdf], which states: “the Mid-Atlantic Ridge runs the entire length of the Atlantic. Vast amounts of the Earth´s inner heat are liberated along these ridges. The heat drives vigorous seawater circulation through the ocean crust.” The figure also shows how the Mid-Atlantic Ridge connects to the Antarctic Peninsula.
According to Smithsonian Institution’s Global Volcanism website, Antarctica has the largest number of active volcanoes in any land region of the world. [http://www.volcano.si.edu/world/region.cfm?rnum=19]. The following citations are from the Smithsonian volcanism website, highlighting some of the active volcanoes.
“The Seal Nunataks are a group of 16 nunataks [nunataks = small areas of rock protruding above glaciers] emerging from the Larsen Ice Shelf east of Graham Land Peninsula. The Seal Nunataks have been described as separate volcanic vents or remnants of a large shield volcano. Fumarolic activity [fumarole = vent in a volcanic area from which hot smoke and gases escape] was reported from Murdoch and Dallman cones in 1982, and fresh-looking pyroclastics and a lava flow at Dallman (not observed in 1979) were seen on the ice surface three years later (González-Ferrán 1983). Fumarolic activity was observed at Christensen in 1893, and Lindenberg was observed in eruption in 1893. Baker (1968) saw cinders on the ice surface, suggesting a 20th-century eruption.”
“Mount Erebus, the world's southernmost historically active volcano, overlooks the McMurdo research station on Ross Island. The 3794-m-high Erebus is the largest of three major volcanoes forming the crudely triangular Ross Island. Continuous lava-lake activity with minor explosions, punctuated by occasional larger strombolian explosions that eject bombs onto the crater rim, has been documented since 1972.”
“Ring-shaped Deception Island, one of Antarctica's most well known volcanoes, contains a 7-km-wide caldera flooded by the sea … and was constructed along the axis of the Bransfield Rift spreading center. Numerous vents located along ring fractures circling the low, 14-km-wide island have been active during historical time.”
“Mount Melbourne is a large undissected stratovolcano along the western coast of the Ross Sea in Antarctica's northern Victoria Land. The volcano displays fumarolic activity that is concentrated along a NNE-SSW line cutting through the summit area and along a line of phreatomagmatic craters on the southern rim of the summit crater. Prominent ice towers and pinnacles were formed from steam condensation around fumarolic vents.”
Further information on Deception Island (near the tip of the Antarctic Peninsula) can be found in “Tectonic, Volcanic, and Hydrothermal Event Sequence on Deception Island (Antarctica)”, Geomarine Letters, March 1995 (Rey, Somoza, Martinez-Frias) [http://www.springerlink.com/content/w70332587h630r5p/]: “active fumaroles and hot-spring areas are associated with the postcollapse episode and linked to normal faulting and present volcanism”.
The following figure shows the location of the volcanoes mentioned above, as well as Zavodovsky Island – an active volcano in the South Sandwich Islands (photos from Smithsonian volcano website).
Thus, while air temperatures in most of Antarctica have been unchanged or slightly cooling (except for the northern part of the Antarctic Peninsula where there is very little land), sea surface temperatures have been increasing around volcanically active areas of the Antarctic Peninsula. This has resulted in the thinning of some ice shelves from below.
In February / March 2008, part of the Wilkins ice shelf collapsed and of course, it was blamed on global warming. The following image shows the MSNBC report on the collapse [http://www.msnbc.msn.com/id/23797247/]. The shear failure of the ice slabs show that it is not caused by melting due to warming in the air – the weakness of the structure had to occur from thinning ice do to warmer local sea temperatures.
The National Snow and Ice Data Center [http://nsidc.org/news/press/20080325_Wilkins.html] provides the following images of the Wilkins ice shelf location in 2008 (left) and in January 1996 (right) [http://nsidc.org/iceshelves/larsenb1999/wilkins.html].
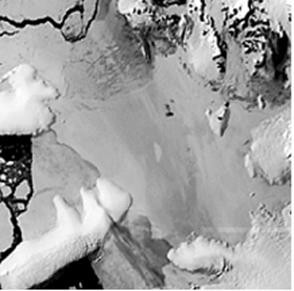
Left: Wilkins Ice Shelf March 2008; Right: Wilkins Ice Shelf January 1996
The Wilkins Ice Shelf disintegrates and re-grows on a regular basis.
For a detailed look at the Wilkins Ice Shelf disintegration, see: http://www.appinsys.com/GlobalWarming/AntarcticWilkinsIceShelf.htm
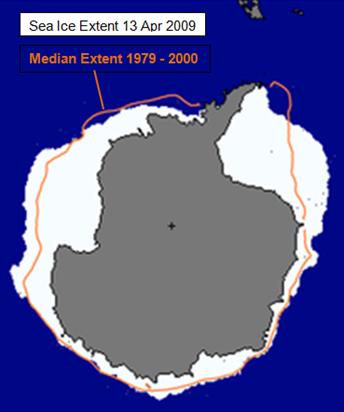
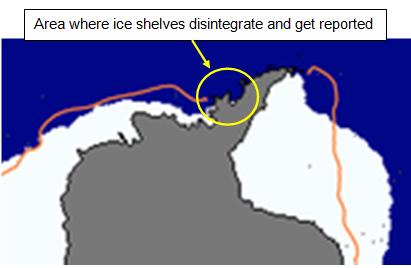
The following figure is from the National Snow and Ice Data Center [http://nsidc.org/data/seaice_index] showing the sea ice extent as of April 2009 compared with the median ice edge (orange line). The figure on the right shows the area including the Wilkins Ice Shelf, which has been losing ice due to warmer ocean waters running into the Antarctic Peninsula.
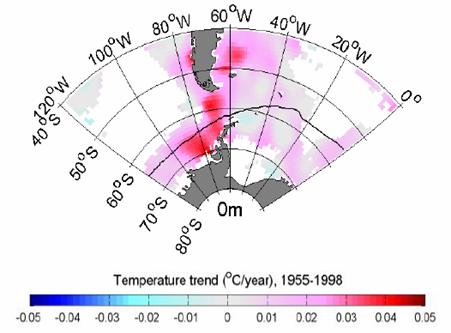
The occurrence of volcanic and fumarolic activity in the area has been documented above. There is also evidence that the El Nino Southern Oscillation results in warm currents that encounter the peninsula, as indicated in the next figure (left) (from “The El Nino–Southern Oscillation and Antarctica” by John Turner of the Antarctic Survey, UK National Environment Research Council, International Journal of Climatology, 2004 [http://www.scar.org/information/elnino/El_Nino.pdf]). The following figure (right) shows the sea surface temperature trend for 1955 to 1998 showing how the Antarctic Peninsula area has warmed significantly compared with the surrounding area. [http://www.ocean-partners.org/documents/Cooper%202007%20lecture.pdf]
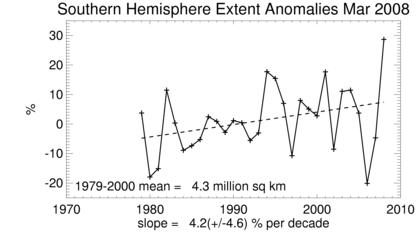
The following figure shows the 30-year trend in sea ice around Antarctica as of March 2008 from the National Snow and Ice Data Center [http://nsidc.org/data/seaice_index] – “vast collapse” of the Wilkins ice shelf does not seem to impact the almost 30 percent larger than normal sea ice extent.
The Antarctic Peninsula (West Antarctica) goes through large variations in temperature. “during a major El Niño event from 1939 to 1942, temperatures in West Antarctica rose by about 6 to 10 degrees F (3-6 degrees C), and then dropped by an estimated 9 to 13 degrees F (5-7 degrees C) over the next two years.” [http://www.sciencedaily.com/releases/2008/08/080812160619.htm]
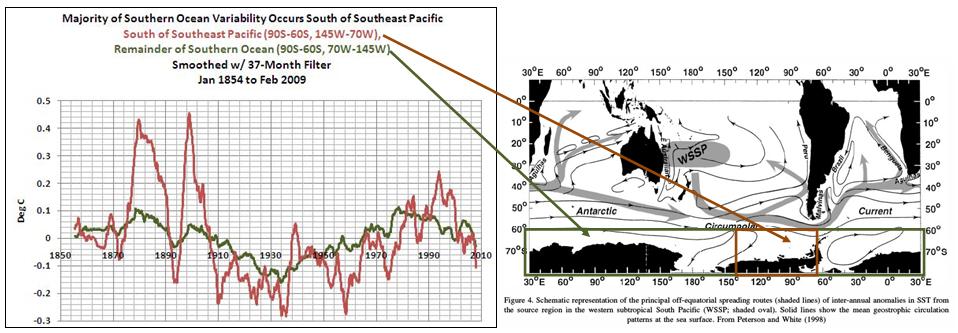
An analysis of southern ocean sea surface temperatures (south of 60S) shows that the greatest variation in SST is in the southeast Pacific, as shown below [http://bobtisdale.blogspot.com/2009/04/closer-look-at-ersstv3b-southern-ocean.html]
See also:
Antarctica: www.appinsys.com/GlobalWarming/RS_Antarctica.htm
Wilkins Ice Shelf: http://www.appinsys.com/GlobalWarming/AntarcticWilkinsIceShelf.htm