Global Warming Science - www.appinsys.com/GlobalWarming
The Climatic Data Sets Available on the AIS Climate Data Visualizer
[last update: 2011/03/08]
|
The term “global warming” is based on an increasing trend in global average temperature over time. The IPCC reported in 2007 that “Global mean surface temperatures have risen by 0.74°C ± 0.18°C when estimated by a linear trend over the last 100 years (1906–2005).” [4AR, Chapter 3, 2007]. However, the measurement of a “global” temperature is not as simple as it may seem. Historical instrumentally recorded temperatures exist only for 100 to 150 years in small areas of the world. During the 1950s to 1980s temperatures were measured in many more locations, but many stations are no longer active in the database.
Average temperatures are calculated at a given location based on the following procedure: record the minimum and maximum temperature for each day; calculate the average of the minimum and maximum. Calculate the averages for the month from the daily data. Calculate the annual averages by averaging the monthly data.
The main global temperature data set is managed by the US National Oceanic and Atmospheric Administration (NOAA) at the National Climatic Data Center (NCDC). This is the Global Historical Climate Network (GHCN) [http://www.ncdc.noaa.gov/ghcnm/v2.php]: “The period of record varies from station to station, with several thousand extending back to 1950 and several hundred being updated monthly”. This is the main source of data for global studies, including the data reported by the IPCC. However, the IPCC uses data processed and adjusted by the UK-based Hadley Climatic Research Unit of the University of East Anglia (HadCRU), although much of the HadCRU raw data comes from the GHCN.
|
|
NOAA Global Historical Climate Network (GHCN) Data
The AIS Climate Data Visualizer provides NOAA temperature and precipitation data. I update this once per year in early February (to allow time for processing of the complete prior year’s data by NOAA). The data contains monthly as well as average annual data. NOAA also provides some minimum and maximum temperature data, although this is not complete for all stations.
NOAA provides a summary of the adjustments made to the USHCN temperature data as shown in the following figure. [http://www.ncdc.noaa.gov/oa/climate/research/ushcn/ushcn.html] The report states: “The cumulative effect of all adjustments is approximately a one-half degree Fahrenheit warming in the annual time series over a 50-year period from the 1940's until the last decade of the century.” This is similar to the total amount of warming “observed”.
Average Total Warming Created by Adjustments to USHCN Data
|
|
Hadley Climatic Research Unit (HadCRU) Gridded Data
The AIS Climate Data Visualizer provides HadCRU temperature (CRUTEM3) and sea surface temperature data (HadSST2). I update this once per year in early February (to allow time for processing of the complete prior year’s data by CRU). The data contains monthly as well as average annual data. CRU does not provide minimum or maximum temperature data.
The UK-based HadCRU provides the following description [http://www.cru.uea.ac.uk/cru/data/temperature/] (emphasis added):
“Over land regions of the world over 3000 monthly station temperature time series are used. Coverage is denser over the more populated parts of the world, particularly, the United States, southern Canada, Europe and Japan. Coverage is sparsest over the interior of the South American and African continents and over the Antarctic. The number of available stations was small during the 1850s, but increases to over 3000 stations during the 1951-90 period. For marine regions sea surface temperature (SST) measurements taken on board merchant and some naval vessels are used. As the majority come from the voluntary observing fleet, coverage is reduced away from the main shipping lanes and is minimal over the Southern Oceans.”
“Stations on land are at different elevations, and different countries estimate average monthly temperatures using different methods and formulae. To avoid biases that could result from these problems, monthly average temperatures are reduced to anomalies from the period with best coverage (1961-90). For stations to be used, an estimate of the base period average must be calculated. Because many stations do not have complete records for the 1961-90 period several methods have been developed to estimate 1961-90 averages from neighbouring records or using other sources of data. Over the oceans, where observations are generally made from mobile platforms, it is impossible to assemble long series of actual temperatures for fixed points. However it is possible to interpolate historical data to create spatially complete reference climatologies (averages for 1961-90) so that individual observations can be compared with a local normal for the given day of the year.”
|
|
HadCRU Station Data
Until December 2009, none of the HadCRU station data used by the IPCC was publicly available – neither the raw data nor the adjusted data, only the adjusted gridded data (i.e. after adjustments are made and station anomalies are averaged for the 5x5 dgree grid). Now, a “subset” of that data has been released.
The AIS Climate Data Visualizer now provides graphing of the CRU station data.
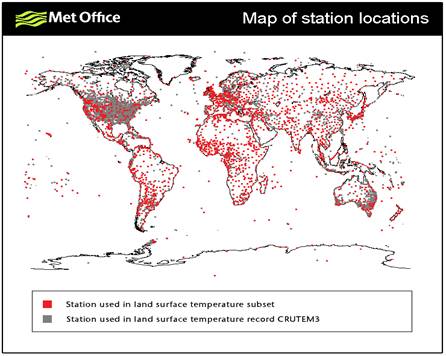
Station locations: The Met Office provides the following map of station locations. The red dots are stations included in the released “subset”.
According to their website: “The data that we are providing is the database used to produce the global temperature series. Some of these data are the original underlying observations and some are observations adjusted to account for non climatic influences, for example changes in observations methods.”
See the CRU Station page: http://www.appinsys.com/GlobalWarming/CRUStationData.htm for more information.
|
|
Temperature Station Data
The NASA Goddard Institute for Space Studies (GISS) is a major provider of climatic data in the US (starting from the NOAA GHCN database and then performing adjustments to the data). The following figure shows the distribution of temperature stations used by the GISS. As can be seen in the figure, the 30 to 60 degree North latitude band contains 69 percent of the stations used and almost half of those are located in the United States. This implies that if these stations are valid, the calculations for the US should be more reliable than for any other area or for the globe as a whole.
Distribution of Temperature Stations around the World
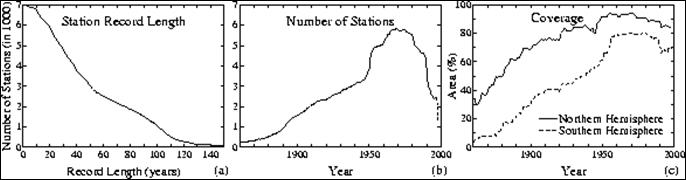
In addition to the extensive problem of station sparseness, the network has also been historically constantly changing - the number of available temperature reporting stations changes with time. The so-called "global" measurements are not really global at all. The coverage by land surface thermometers slowly increased from less than 10% of the globe in the 1880s to about 40% in the 1960's, but has decreased rapidly in recent years. The GISS web site shows how the number of stations has changed, as shown in the following figure [http://data.giss.nasa.gov/gistemp/station_data/]. Note that in the figure c) the definition of percent coverage is based on “percent of hemispheric area located within 1200 km (720 miles) of a reporting station”! Yet 720 miles is about twice the width or height of the largest 5x5 degree grid box.
Number of Stations over Time (c shows the percent of hemispheric area located within 1200km of a reporting station)
There was a major disappearance of recording stations in the late 1980’s – early 1990’s. The following figure compares the number of global stations in 1900, 1970s and 1997 showing the increase and then decrease. [Peterson and Vose: http://www.ncdc.noaa.gov/oa/climate/ghcn-monthly/images/ghcn_temp_overview.pdf ].
a) 1900
b) 1976
c) 1997 Comparison of Available GHCN Temperature Stations Over Time
The following figure shows the number of stations in the GHCN database with data for selected years, showing the number of stations in the United States (blue) and in the rest of the world (ROW – green). The percents indicate the percent of the total number of stations that are in the U.S.
Comparison of Number of GHCN Temperature Stations in the U.S. vs Rest of the World (ROW)
|
|
The recorded temperature data recorded from the stations is not simply used in the averaging calculations: it is first adjusted. Different agencies use different adjustment methods. The station data is adjusted for homogeneity (i.e. nearby stations are compared and adjusted if trends are different).
Temperature station adjustments are theoretically supposed to make the data more realistic for identifying temperature trends. In some cases the adjustments make sense, in many cases they do not. See the link below for examples.
See http://www.appinsys.com/GlobalWarming/GW_Part2_GlobalTempMeasure.htm for more details on global temperature calculations.
|
|
|