Global Warming Science - www.appinsys.com/GlobalWarming
Hadley Climatic Research Unit (CRU) Releases Station Data Subset
[last update: 2009/12/13]
|
CRU Releases Station Data – Added to AIS Climate Visualizer
The Hadley Climatic Research Unit (CRU) provides data to the IPCC. They process temperature station data into adjusted averages for 5x5 degree grids covering the world. On December 7, 2009 CRU decided to release the individual station data for a “subset” of the stations used in their gridded data. See: http://www.metoffice.gov.uk/climatechange/science/monitoring/subsets.html
This CRU station data has been added to the interactive data graphing on the AIS Climate Data Visualizer: http://www.appinsys.com/globalwarming/climate.aspx
The climate graphing has a new button labeled: “HadCRU Temperature Data” providing graphing of individual stations from the CRU data, as well as anomalies and averaging. CRU provides annual averages and monthly averages only – no minimum or maximum temperature data.
Graph screen:
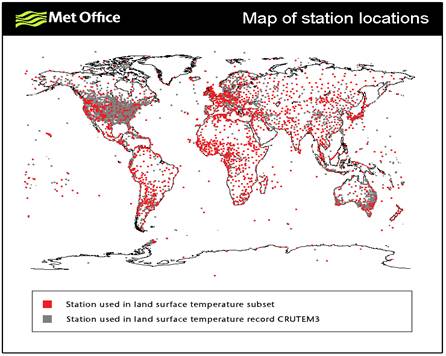
Station locations: The Met Office provides the following map of station locations. The red dots are stations included in the released “subset”.
According to their website: “The data that we are providing is the database used to produce the global temperature series. Some of these data are the original underlying observations and some are observations adjusted to account for non climatic influences, for example changes in observations methods.”
Also, “why these stations?”: “The choice of network is designated by the World Meteorological Organization for monitoring global, hemispheric and regional climate and variability.”
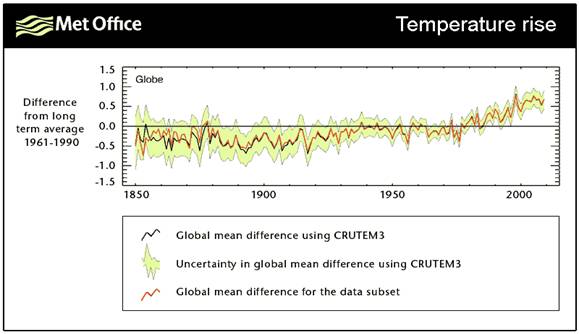
They also make the statement: “This subset shows that global average land temperatures have risen over the last 150 years and is very similar to the temperature rises shown by the complete data set.” The following figure from their web site compares the global average for the whole data set (black) and the subset (red).
Most of the stations in the released subset are also in the NOAA GHCN database, although there some additions. The subset contains 1,727 temperature stations, of which 1,585 are also in the GHCN database. CRU calculates temperature anomalies based on differences from the average of the 1960 – 1991 period. Not all of the released stations have temperatures available for the full 1960 – 1991 period. For example, 147 stations have no data in this period.
|
|
|
|
IPCC Attribution to CO2
As mentioned above, the Met Office makes the statement: “This subset shows that global average land temperatures have risen over the last 150 years”. Many in the media portray the global warming issue as “the global average temperature has increased 0.8 degrees during the 20th century”. But climate scientists do not claim that this was all due to CO2 – only since the 1970s.
In a CRU email between Edward Cook and Michael Mann in May 2001, Cook stated: “most researchers in global change research would agree that the emergence of a clear greenhouse forcing signal has really only occurred since after 1970. I am not debating this point, although I do think that there still exists a significant uncertainty as to the relative contributions of natural and greenhouse forcing to warming during the past 20-30 years at least.” [http://www.eastangliaemails.com/emails.php?eid=228&filename=988831541.txt]
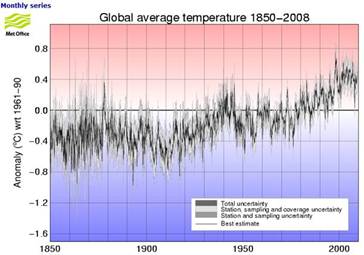
The figure below left shows the global average temperature anomalies (from the Hadley Climatic Research Unit (CRU) which provides the data used by the IPCC [http://hadobs.metoffice.com/hadcrut3/diagnostics/global/nh+sh/]).
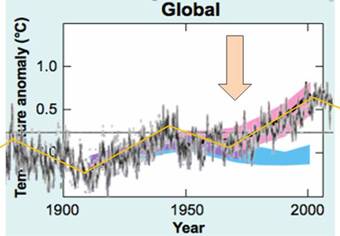
The figure below right superimposes the CRU temperature anomalies on the IPCC graph of model outputs. (IPCC 2007 AR4 Figure SPM-4 [http://www.ipcc.ch/pdf/assessment-report/ar4/syr/ar4_syr_spm.pdf]) In this figure, the blue shaded bands show the result climate model simulations using only natural forcings. Red shaded bands show the result model simulations including anthropogenic CO2.
This clearly shows that prior to about 1973, the global warming is fully explained by climate models using only natural forcings (i.e. no human CO2). The models need input of CO2 only after about the mid-1970s – prior to 1970 all warming was natural, according to the IPCC. (There is no empirical evidence relating CO2 to the post-1970s warming as a causative factor. The only evidence is the fact that the computer models require CO2 to produce warming.)
The IPCC attributes “most” of the warming since 1970 to human-produced (anthropogenic) greenhouse gases – mainly CO2. One must keep in mind that the IPCC was formed in 1988 with the purpose of assessing “the understanding of the risk of human-induced climate change.” -- i.e. it is based on the a priori assumption of “human-induced climate change” – there was never an attempt to evaluate the scientific evidence of the cause. (See: http://www.appinsys.com/GlobalWarming/GW_History.htm for the history).
|
|
|
|
Warming Significant Only in 10-20% of the World
In November 2009, CRU had various emails hacked and released. A CRU email from Phil Jones to Michael Mann, Malcolm Hughes and others, Mar 11, 2003, stated: “Even with the instrumental record, the early and late 20th century warming periods are only significant locally at between 10-20% of grid boxes.” [http://www.anelegantchaos.org/cru/emails.php?eid=296&filename=1047390562.txt]
See: http://www.appinsys.com/GlobalWarming/AnthroGWMyth.htm for more information on this.
|
|
|