Global Warming Science - www.appinsys.com/GlobalWarming
The Myth of Anthropogenic Global Warming – The 10 Percent Solution
[last update: 2009/11/30]
|
Warming Significant Only in 10-20% of the World
The Hadley Climatic Research Unit (CRU) provides data to the IPCC. They process temperature station data into adjusted averages for 5x5 degree grids covering the world. In November 2009, CRU had various emails hacked and released. A CRU email from Phil Jones to Michael Mann, Malcolm Hughes and others, Mar 11, 2003, stated: “Even with the instrumental record, the early and late 20th century warming periods are only significant locally at between 10-20% of grid boxes.” [http://www.anelegantchaos.org/cru/emails.php?eid=296&filename=1047390562.txt] (What a difference statistics can make in creating false illusions like “global” warming.)
|
||||||
|
|
||||||
|
Many in the media portray the global warming issue as “the global average temperature has increased 0.8 degrees during the 20th century”. But climate scientists do not claim that this was all due to CO2 – only since the 1970s. In a CRU email between Edward Cook and Michael Mann in May 2001, Cook stated: “most researchers in global change research would agree that the emergence of a clear greenhouse forcing signal has really only occurred since after 1970. I am not debating this point, although I do think that there still exists a significant uncertainty as to the relative contributions of natural and greenhouse forcing to warming during the past 20-30 years at least.” [http://www.eastangliaemails.com/emails.php?eid=228&filename=988831541.txt]
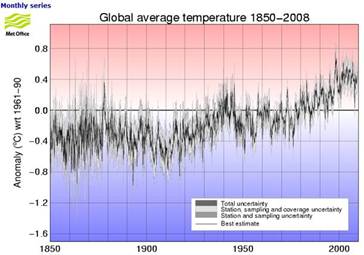
The figure below left shows the global average temperature anomalies (from the Hadley Climatic Research Unit (CRU) which provides the data used by the IPCC [http://hadobs.metoffice.com/hadcrut3/diagnostics/global/nh+sh/]).
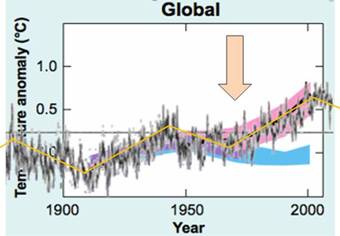
The figure below right superimposes the CRU temperature anomalies on the IPCC graph of model outputs. (IPCC 2007 AR4 Figure SPM-4 [http://www.ipcc.ch/pdf/assessment-report/ar4/syr/ar4_syr_spm.pdf]) In this figure, the blue shaded bands show the result climate model simulations using only natural forcings. Red shaded bands show the result model simulations including anthropogenic CO2.
This clearly shows that prior to about 1973, the global warming is fully explained by climate models using only natural forcings (i.e. no human CO2). The models need input of CO2 only after about the mid-1970s – prior to 1970 all warming was natural, according to the IPCC. (There is no empirical evidence relating CO2 to the post-1970s warming as a causative factor. The only evidence is the fact that the computer models require CO2 to produce warming.)
The IPCC attributes “most” of the warming since 1970 to human-produced (anthropogenic) greenhouse gases – mainly CO2. One must keep in mind that the IPCC was formed in 1988 with the purpose of assessing “the understanding of the risk of human-induced climate change.” -- i.e. it is based on the a priori assumption of “human-induced climate change” – there was never an attempt to evaluate the scientific evidence of the cause. (See: http://www.appinsys.com/GlobalWarming/GW_History.htm for the history).
|
||||||
|
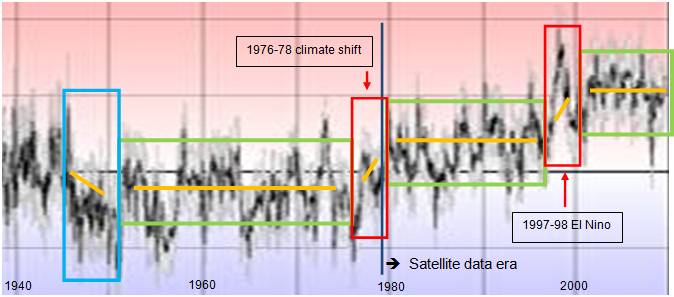
Global Average Temperature Regimes
The following figure examines the global temperature regimes over the past 70 years (from the temperature graph shown above). Temperatures can vary widely from year to year, generally within a 0.5 degree range (the green bounded rectangles below). Following the 1945 – 1951 cooling event, the temperatures were in a stable regime until the 1976-78 climate shift which resulted in a net warming of about 0.2 – 0.3 degrees. Another stable regime is exhibited for the next almost 20 years until the 1997-98 El Nino, which again resulted in about a 0.3 degree net warming. Since then there has been no further warming for the last 10 years.
All of the warming in the last 70 years occurred in two extremely short periods. And this is the time frame covering the entire period officially designated as having warming due to CO2.
For more information on the 1976-78 climate shift, see: http://www.appinsys.com/GlobalWarming/The1976-78ClimateShift.htm
For more information on the 1997-98 El Nino, see: http://www.appinsys.com/GlobalWarming/ENSO.htm
For a discussion of the use of linear trends, see: http://www.appinsys.com/GlobalWarming/LinearTrends.htm
|
||||||
|
Warming Significant Only in 10-20% of the World – Where is It ?
As mentioned previously, a CRU email from Phil Jones to Michael Mann and others stated: “Even with the instrumental record, the early and late 20th century warming periods are only significant locally at between 10-20% of grid boxes.” [http://www.anelegantchaos.org/cru/emails.php?eid=296&filename=1047390562.txt]
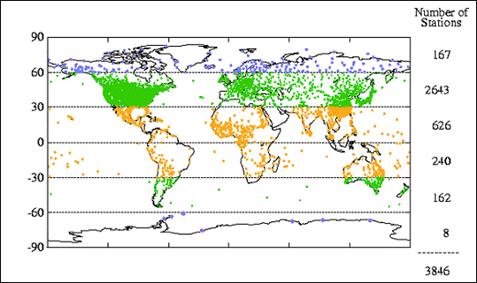
Prior to the satellite era, reliable long-term temperature measurements have only been made in “western” countries. The following figure shows the distribution of temperature stations that have data spanning at least 1960 - 1990. Most countries have very sporadic data.
Worldwide Distribution of Temperature Stations
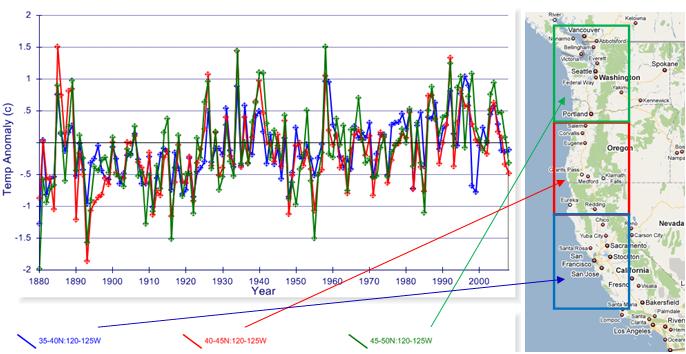
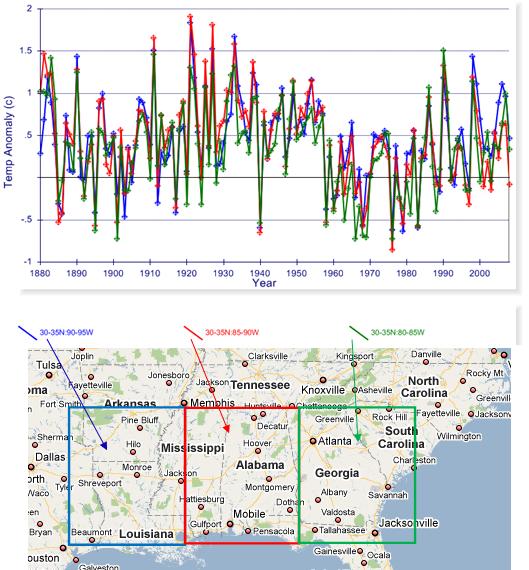
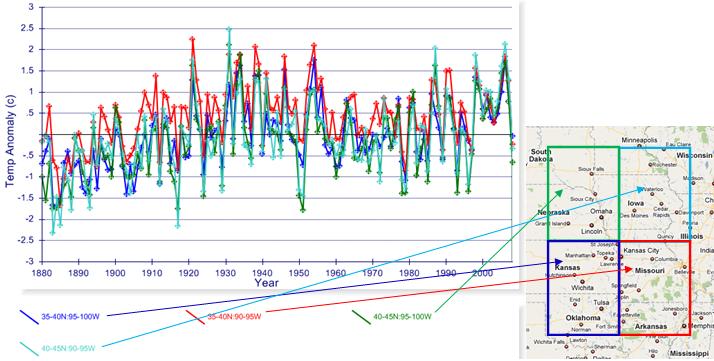
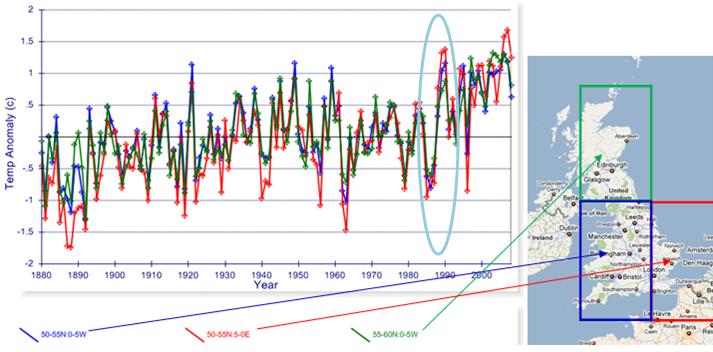
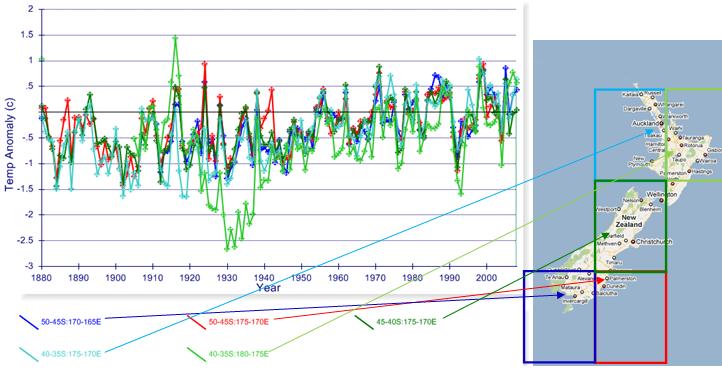
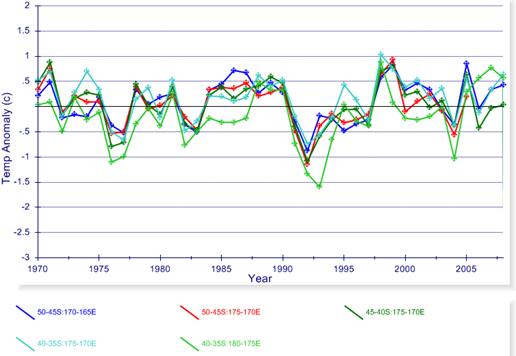
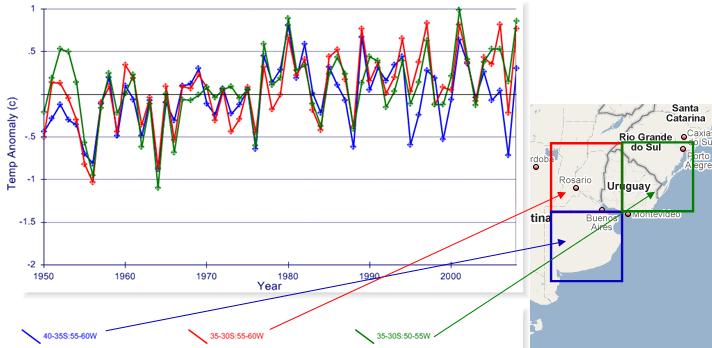
The following graphs show a few regional examples of the 5x5 degree gridded data from the CRU gridded data showing average annual temperature anomalies for 1880 through 2008 (CRUTEM3 database plotted at: http://www.appinsys.com/GlobalWarming/climate.aspx)
The annual temperature variation in a local region is much larger than the global average portrayed by CRU. The global average displaying an apparently small amount of variation is a statistical artifact created by averaging areas that have different trends.
A CRU email from Chick Keller to Michael Mann, Phil Jones and others (Mar 2, 2001) said: “Another way would be to average the records. The resulting temperature amplitude would be smaller because extremes would cancel since variability is large and each region's extremes occur at different times. … if people simply looked at several records they would get the impression that temperature variations were large, ~1.5°C. Imagine their surprise when they see that the ensemble averages you publish have much smaller amplitude.” [http://www.anelegantchaos.org/cru/emails.php?eid=219&filename=983566497.txt] Although Keller was referring to averaging 1000-year regional temperature reconstructions, his statements are also true for averaging annual measurements from different regions of the world.
|
||||||
|
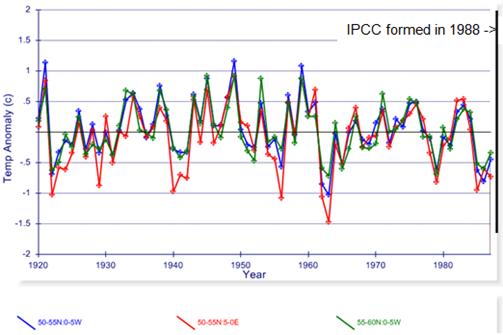
It is hard to find the 10 – 20 % of the grid boxes that have significant warming in the CO2 warming era. Most of the world’s grids have missing data. Europe is one of the few areas where the HadCRU data shows warming since 1988 and the UK Met Office says there was increased sunshine.
Anthropogenic CO2-caused warming? It’s a myth. When the warming is confined to such a small area, it cannot be shown to be due to CO2.
|
||||||
|
Global Warming Not Global
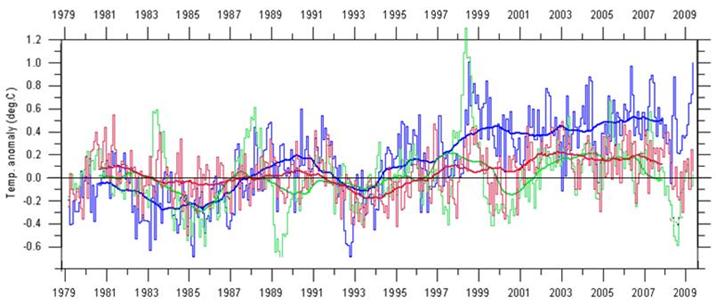
The following figure shows the global average lower troposphere temperature (near the Earth’s surface) from satellite data, for the northern hemisphere (north of 20N), tropics (20N – 20S) and southern hemisphere (south of 20S). The northern hemisphere has warmed about 0.5 degrees C, while the southern hemisphere has warmed about 0.1 C and the tropics show no net warming over the 30 years of available satellite data (figure adapted from http://climate4you.com/). (Satellite data is more reliable than averages of surface stations, but is only available since 1979 - which covers most of the period that the IPCC says exhibits warming due to CO2.)
For more information on the evidence that the “global” warming is actually confined to a relatively small area, see: http://www.appinsys.com/GlobalWarming/GW_NotGlobal.htm
|
||||||
|
|