Global Warming Science - www.appinsys.com/GlobalWarming
Arctic Oscillation Regime Shift
[last update: 2011/02/16]
|
Arctic Oscillation (AO)
“The AO index describes the relative intensity of a semipermanent low-pressure center over the North Pole. A band of upper-level winds circulates around this center, forming a vortex. When the AO index is positive and the vortex intense, the winds tighten like a noose around the North Pole, locking cold air in place. A negative AO and weak vortex … allow intrusions of cold air to plunge southward into North America, Europe, and Asia. … the index has been mostly positive in wintertime since the late 1980s. The Arctic Oscillation has strengthened in recent decades, contributing to the unusual warmth over the Northern Hemisphere land masses.” [http://www.ucar.edu/communications/newsreleases/2003/deser.html]
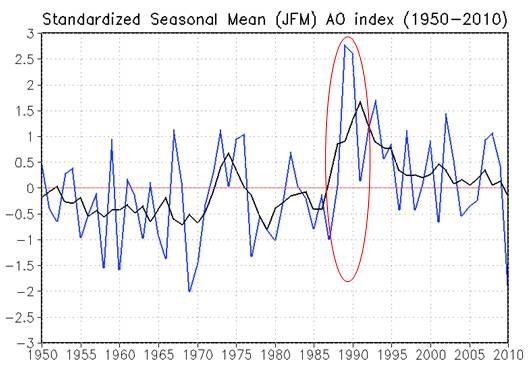
The following figure shows the winter (Jan/Feb/March) AO index. [http://www.cpc.ncep.noaa.gov/products/precip/CWlink/daily_ao_index/JFM_season_ao_index.shtml] The AO index made a major uptrend in 1988/89 and was generally at an increased level for the next 20 years. In 2010 the AO plunged to the lowest level since 1969 (AO data are only available since 1950).
For more info on the effects of the 2010 plunge in the AO index see: http://www.appinsys.com/GlobalWarming/USsnow_Jan2011.htm
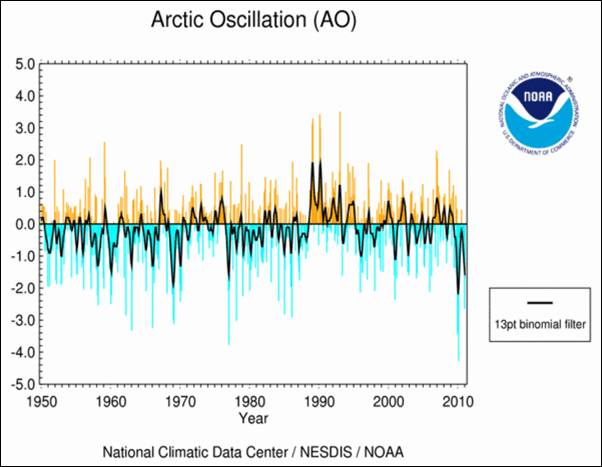
The following figure shows monthly AO (from [http://www1.ncdc.noaa.gov/pub/data/cmb/teleconnections/ao-f-pg.gif]) although the winter AO (JFM) is more typical as this is the period with stronger influence on the Northern Hemisphere weather.
|
|
AO 1988/89 Regime Shift
The AO index showed an abrupt increase in 1988/89 as indicated by the red circle above, resulting in generally higher levels for the next two decades.
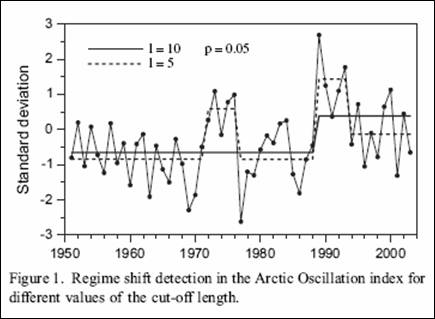
A 2005 paper (Rodionov and Overland: “Application of a sequential regime shift detection method to the Bering Sea ecosystem”, ICES Journal of Marine Sciences 62, 2005 [http://www.beringclimate.noaa.gov/regimes/JMSPublArticle.pdf]) applied a regime shift detection algorithm based on sequential t-test analysis to the AO index. They state: “Regime shifts are defined as rapid reorganizations of ecosystems from one relatively stable state to another. In the marine environment, regimes may last for several decades, and shifts often appear to be associated with changes in the climate system.” They examined the AO index regimes based on various cut-off lengths. The year 1989 was identified as a AO regime change by all of the cut-off lengths, as illustrated in the following figure.
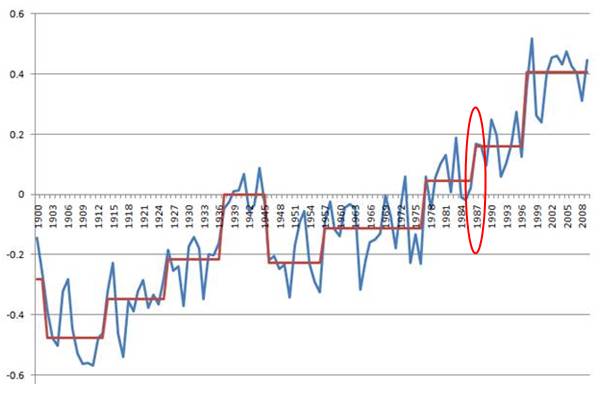
A previous study on regime shifts based on global average temperature anomalies (using a different regime shift detection algorithm), identified 1987/88 as a regime shift, as illustrated below (see: http://www.appinsys.com/GlobalWarming/ClimateRegimeShift.htm).
Overland et al “Decadal Variability of the Aleutian Low and Its Relation to High-Latitude Circulation” [http://journals.ametsoc.org/doi/abs/10.1175/1520-0442(1999)012%3C1542%3ADVOTAL%3E2.0.CO%3B2]: “An objective algorithm detects zero crossings of Aleutian low central pressure anomalies in 1925, 1931, 1939, 1947, 1959, 1968, 1976, and 1989. No single midtropospheric teleconnection pattern is sufficient to capture the variance of the Aleutian low. The Aleutian low covaries primarily with the Pacific–North American (PNA) pattern but also with the Arctic Oscillation (AO). The change to a prominent deep Aleutian low after 1977 is seen in indices of both the PNA and AO; the return to average conditions after 1989 was also associated with a change in the AO.”
Numerous studies have documented the effects of the 1989 climate shift:
The 1988-89 regime shift is not as strong – it does not show up in as many ecological indicators as the 1976-77 (as documented in Overland et al “North Pacific regime shifts: Definitions, issues and recent transitions” [http://www.faralloninstitute.org/Publications/hare-mantua_pio2000.pdf]). However, in terms of the Arctic Oscillation, it is the strongest regime shift.
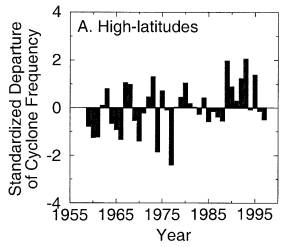
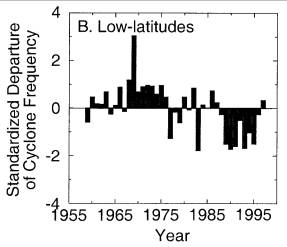
The 1989 shift is also manifested in the northern winter cyclone frequency. The following figures show the standardized departures of winter (Nov-Mar) cyclone counts in the northern hemisphere for 60 – 90 degrees N (left) and 30 – 60 degrees N (right) “a pronounced increase in cyclone frequency in high latitudes and a pronounced decrease in midlatitudes around 1989. These changes occur coincident with a significant change in the Arctic oscillation (AO) index. … During positive AO conditions cyclone activity in the Northern Hemisphere shifts poleward. … When the AO is negative, the polar vortex is in a weakened state and cyclone activity shifts south.” [http://nome.colorado.edu/HARC/Readings/McCabe.pdf]
|
|
AO and Climate Models
A common problem with climate scientists is the misuse of linear trends. According to UCAR “The NAM trended toward positive values from the 1960s until the early to mid-1990s, with more variability after that point. … Based on computer-model results and physical reasoning, scientists have expected the global increase in greenhouse gases to foster a slightly positive NAM trend over the coming century.” (The NAM – Northern Annular Mode is another name for the Arctic Oscillation.) [http://www2.ucar.edu/news/backgrounders/arctic-oscillation-pineapple-express-weather-maker-glossary#_nam]
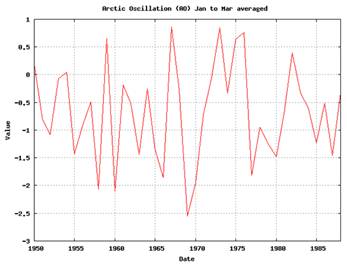
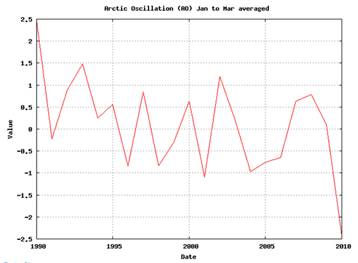
The UCAR is very misleading in the above statements. The AO showed little to slightly negative trend until the 1988/89 shift, and has shown a distinct negative trend since then. The highest variability occurred in the 1970s. This can be seen in the following plots of the AO for 1950 – 1987 (left) and from 1990 – 2010 (right) (plots from http://www.esrl.noaa.gov/psd/data/climateindices/, note y-axes are different scales). They refer to a positive linear trend from the carefully selected start and end dates 1960s – 1990s without concern that there is a shift in the middle of that period and the trends either side of the shift do not match their statement.
UCAR also states that increase in greenhouse gases are expected to foster a slight positive trend. But the data show that, except for the 1988/89 shift, there is no increase in AO while greenhouse gases keep rising.
Various papers examine climate models and show the same model / reality disconnect. For example, Gillett et al, 2002 (“How linear is the Arctic Oscillation response to greenhouse gases?” Journal of Geophysical Research [http://www.agu.org/pubs/crossref/2002.../2001JD000589.shtml]): “We examine the sensitivity of the Arctic Oscillation (AO) index to increases in greenhouse gas concentrations in integrations of five climate models … With the exception of HadCM2 all the models show a significant positive AO response to greenhouse gas forcing”
A 2010 paper (Lo and Hsu, “Change in the dominant decadal patterns and the late 1980s abrupt warming in the extratropical Northern Hemisphere”, Atmospheric Science Letters Vol. 11, [http://onlinelibrary.wiley.com/doi/10.1002/asl.275/full]) states: “Widespread abrupt warming in the extratropical Northern Hemisphere (NH) occurred in the late 1980s. This warming was associated with a change in the relative influence of the Pacific Decadal Oscillation (PDO)-like pattern and the Arctic Oscillation (AO)-like pattern. The AO-like pattern has had a dominant influence on the NH-mean temperature since the late 1980s, whereas the influence of the PDO has weakened. The AO-like mode appears as part of natural variability in the pre-industrial simulations of the CMIP3/IPCC climate models. However, its emergence in the late 1980s was not simulated by most models with or without the observed increasing greenhouse effect in the 20th century.”
|
|
Solar Connection
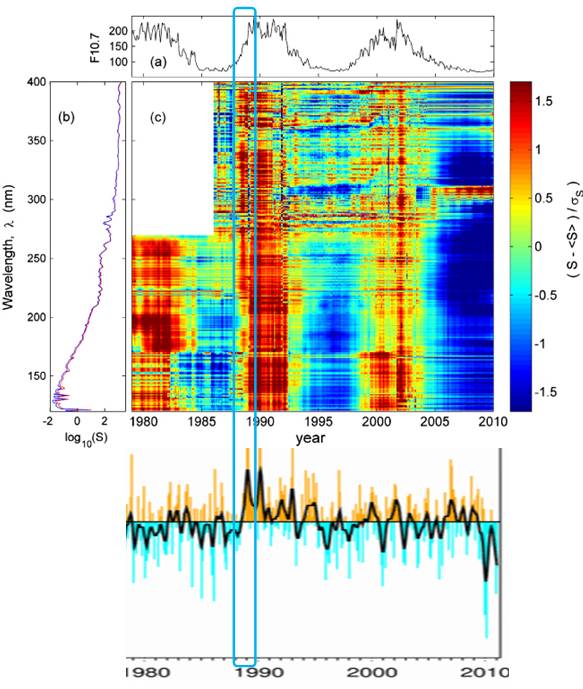
The AO data period (1950 to present) covers 5 solar cycles (19 through 23). However satellite data covering spectral irradiance information began only in 1979, covering cycles 22 and 23 and most of cycle 21. The following figure shows the UV spectral radiation for the available period (from Lockwood et al: “Top-down solar modulation of climate: evidence for centennial-scale change” Environmental Research Letters, 2010, [http://iopscience.iop.org/1748-9326/5/3/034008/fulltext]). The figure shows (a) the F10.7 flux, (b) the UV spectral irradiance monthly means and (c) the variation of spectral irradiance. The monthly AO index is plotted in the bottom graph. The 1988-89 period is highlighted. It involves the onset of an intense increase in irradiance across the UV spectrum. There is a clear correlation between the AO and UV spectral irradiance.
Baldwin and Dunkerton (“The solar cycle and stratosphere–troposphere dynamical coupling”, Journal of Atmospheric and Solar-Terrestrial Physics, 2005 [http://www.nwra.com/resumes/baldwin/pubs/SolarCycleStrat_TropDynamicalCoupling.pdf]) state:
It is likely that models that do not incorporate UV irradiance / ozone effects will not be effective. Nissen et al (“Towards a better representation of the solar cycle in general circulation models”, Atmospheric Chemistry and Physics, 2007 [http://www.atmos-chem-phys-discuss.net/7/45/2007/acpd-7-45-2007.pdf]) state: “11-year solar UV irradiance variations have a direct impact on the radiation and ozone budget of the middle atmosphere. In order to account for these changes a model needs to include spectrally resolved solar irradiance changes as well as ozone changes due to enhanced photo-chemical production”
Although the science remains unsettled, an AO – solar connection is evident.
|
|
Papers Examining AO – Solar Connection
De La Torre et al: “The role of the solar cycle in the relationship between the North Atlantic Oscillation and Northern Hemisphere surface temperatures” Advances in Atmospheric Sciences 2007 [http://www.springerlink.com/content/h6m2535428606445/] “solar activity influences tropospheric climate fluctuations in the Northern Hemisphere via the fluctuations of the stratospheric polar vortex.”
Da Silva and Avissar: “The impacts of the Luni-Solar oscillation on the Arctic oscillation” Geophysical Research Letters 2005 [http://www.duke.edu/~renato/RamosdaSilvaandAvissarGRL2005.pdf] “In this study, we show that specific alignments between the Sun, the Moon and the Earth known as the Luni-Solar Oscillation (LSO) that occur at frequencies of nearly 9 and 18 years are unambiguously correlated with the AO since the mid-1960’s.”
Tourpali et al: “Solar cycle modulation of the Arctic Oscillation in a chemistry-climate model” Geophysical Research Letters 2005 [http://www.agu.org/journals/ABS/2005/2005GL023509.shtml]
Huth et al: “The 11-year solar cycle affects the intensity and annularity of the Arctic Oscillation” Journal of Atmospheric and Solar-Terrestrial Physics 2007 [http://adsabs.harvard.edu/abs/2007JASTP..69.1095H]
Hameed and Lee: “A mechanism for sun-climate connection” Geophysical Research Letters 2005 [http://www.somas.stonybrook.edu/downloads/pubs/hameed/HameedLee.pdf]
Ruzmaikin and Feynman: “Solar influence on a major mode of atmospheric variability” Geophysical Research Letters 2002 [http://yly-mac.gps.caltech.edu/ReprintsYLY/A_LWSpapers/Ruzmaikin_Solar_02.pdf]
Shidell, Schmidt, Mann, Rind and Waple: “Solar Forcing of Regional Climate Change During the Maunder Minimum”, Science, 2001 [http://pubs.giss.nasa.gov/docs/2001/2001_Shindell_etal_1.pdf]
Barriopedro et al: “Solar modulation of Northern Hemisphere winter blocking” Journal of Geophysical Research, Vol.113, 2008 [http://idl.ul.pt/davidbarriopedro/2008%20Barriopedro%20et%20al.pdf]
Lockwood et al: “Top-down solar modulation of climate: evidence for centennial-scale change” Environmental Research Letters, 2010 [http://iopscience.iop.org/1748-9326/5/3/034008/fulltext]
|
|
More info about the AO: http://www.appinsys.com/GlobalWarming/AO_NAO.htm
|
|
|