Global Warming Science - www.appinsys.com/GlobalWarming
US Cold and Snow – January 2011
[last update: 2011/02/22 – NOAA section added]
[original: 2011/02/09]
|
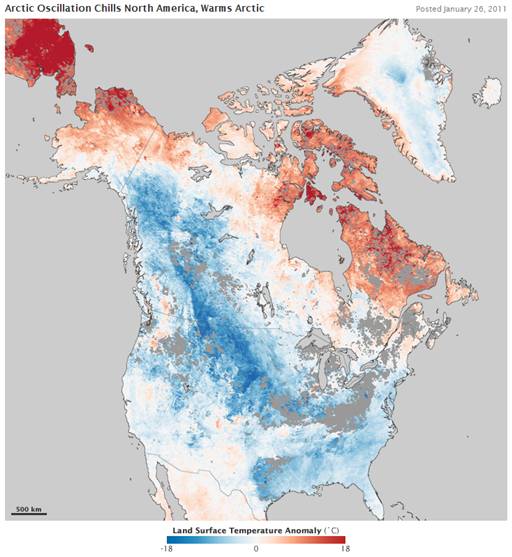
January 2011: “Snow fell in the U.S. Deep South, severe storms battered the East Coast, and International Falls, Minnesota, set a new temperature record: -46 degrees Fahrenheit (-43 degrees Celsius) on January 21. But in areas north of the United States and southern Canada, temperatures were above normal.” [http://earthobservatory.nasa.gov/IOTD/view.php?id=48882]
The following figure is from the above source, showing temperature anomalies over North America in January.
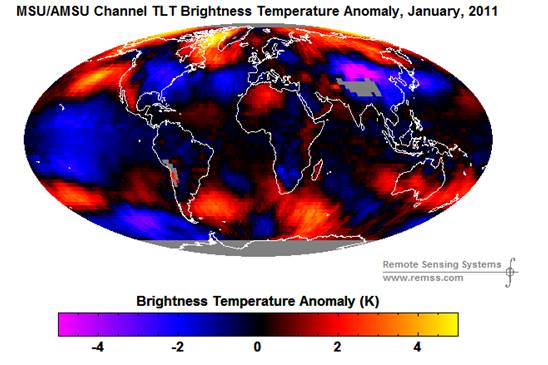
The following figure shows temperature anomalies from the RSS processing of satellite data for January 2011. [http://www.remss.com/data/msu/graphics/tlt/medium/global/ch_tlt_2011_01_anom_v03_2.png]
|
|
North Atlantic Oscillation (NAO)
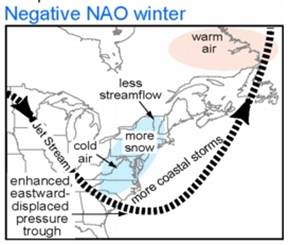
The NAO index is calculated based on the difference between the normalized sea level pressures over Gibraltar (or Portugal, or the Azores) (subtropical high) and Southwest Iceland (polar low). A negative NAO: “US east coast experiences more cold air outbreaks and hence snowy weather conditions” [http://www.ldeo.columbia.edu/res/pi/NAO/]
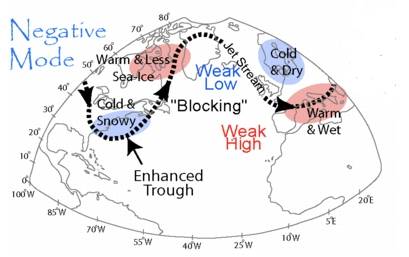
The following figures show the effect of the NAO on winter conditions. [http://airmap.unh.edu/background/nao.html]
The following figure compares the expected negative NAO effects with the RSS January 2011 temperature anomalies.
Note in the above that the weakened jet stream causes a “blocking” pattern. This is similar to the blocking pattern observed in the summer of 2010 causing a heat wave in Russia (see: http://www.appinsys.com/GlobalWarming/Russia2010.htm)
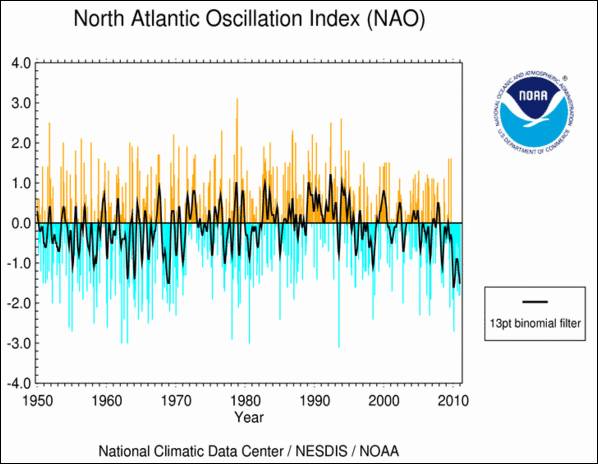
The NAO went strongly negative in 2010 as shown in the following figure. [http://www.ncdc.noaa.gov/teleconnections/nao/]
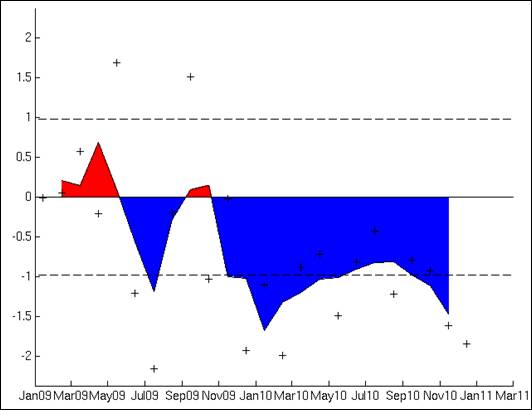
The following figure shows the NAO from January 2009 through December 2010. [http://ioc3.unesco.org/oopc/state_of_the_ocean/atm/nao.php]
The blocking pattern associated with the above trend to negative NAO in Nov/Dec 2009 is examined in this reference: [http://nws.met.psu.edu/severe/2010/01Jan2010.pdf]
|
|
Arctic Oscillation (AO)
“The AO index describes the relative intensity of a semipermanent low-pressure center over the North Pole. A band of upper-level winds circulates around this center, forming a vortex. When the AO index is positive and the vortex intense, the winds tighten like a noose around the North Pole, locking cold air in place. A negative AO and weak vortex … allow intrusions of cold air to plunge southward into North America, Europe, and Asia. … the index has been mostly positive in wintertime since the late 1980s. The Arctic Oscillation has strengthened in recent decades, contributing to the unusual warmth over the Northern Hemisphere land masses.” [http://www.ucar.edu/communications/newsreleases/2003/deser.html]
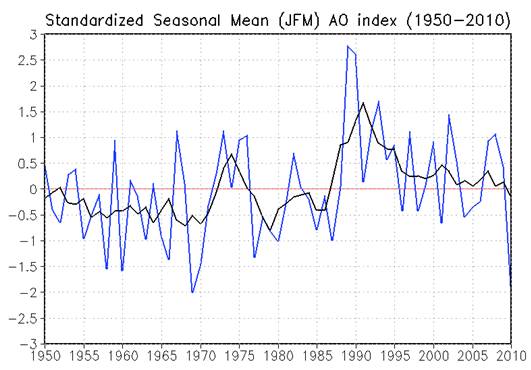
The following figure shows the winter AO. Similar to the NAO, the AO went strongly negative in 2010. [http://www.cpc.ncep.noaa.gov/products/precip/CWlink/daily_ao_index/JFM_season_ao_index.shtml]
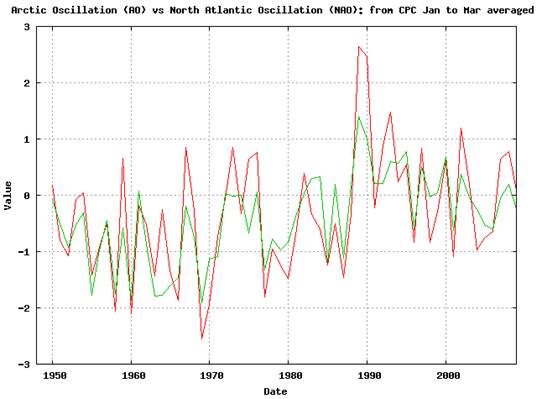
The AO and NAO are highly correlated (and not generally considered to be separate phenomena, at least for winter months). The following graph compares the two (for JFM) with AO in red and NAO in green (correlation 0.83) [http://www.esrl.noaa.gov/psd/data/climateindices/]
The negative AO is “Characterized by higher than normal pressures over the Arctic region and a breakdown of the polar vortex”. The NAO is considered by some to be a regional representation of the AO. This is discussed in this reference: [www.crh.noaa.gov/images/eax/science/WinterWxAO2006.ppt]
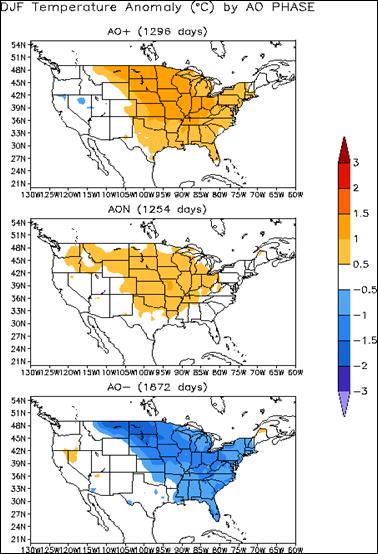
The following figure shows the effect of the AO on temperature anomalies in the United States (from the above reference).
|
|
Blocking
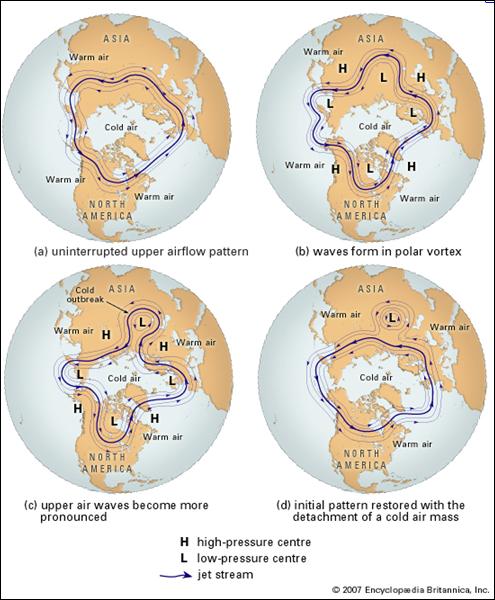
The negative AO/NAO is associated with a slowed polar vortex and polar jet stream. When the jet stream slows, it meanders in a waveform pattern (Rossby waves). The general effect is illustrated below (from http://en.wikipedia.org/wiki/Rossby_wave).
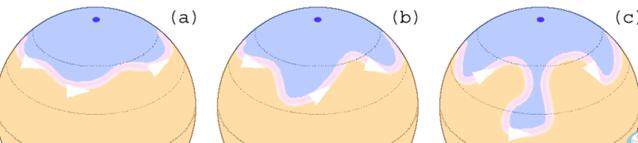
And a polar view (from https://www.britannica.com/EBchecked/topic-art/38479/106997/Rossby-wave-patterns-over-the-North-Pole-depicting-the-formation) showing the blocking pattern in (c)
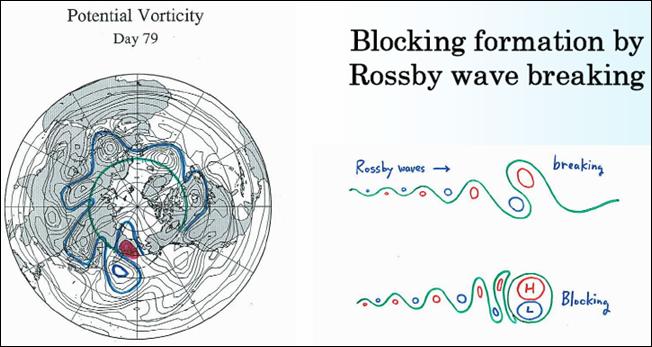
The following figure illustrates the wave breaking to create the blocking pattern (from http://www.apcc21.org/images/Activities/seminar/2006/APCC06-Tanaka.pdf)
“Blocking has a lot to do with the severity of winter weather in the Northern Hemisphere, and the AO has a strong ability to control blocking. To quantify this control, we define a blocking event as a week or more of excess pressure in the midtroposphere together with an anticyclone at the surface. … blocking occurs preferentially during the low AO phase in Alaska, the North Atlantic, and Russia.” [http://www.jisao.washington.edu/wallace/ncar_notes/]
|
|
Al Gore – Non-Science
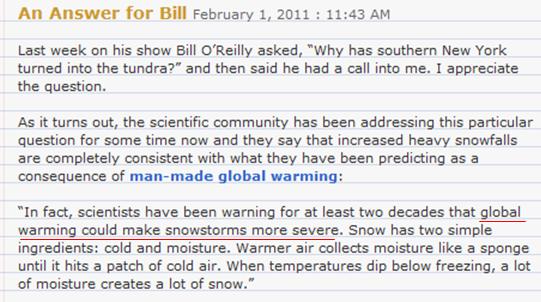
Al Gore says the unusual cold and snow in the Northeast US this January is due to global warming. The image below is from his blog [http://blog.algore.com/2011/02/an_answer_for_bill.html]
When every possible weather / climate feature is “consistent” with “man-made global warming”, the hypothesis is not falsifiable and is therefore not scientific.
Although Gore was doing his usual lying, many mainstream media outlets were telling the truth.
Examples:
USA Today, Dec 29: “Teeth-chattering, bitterly cold winds have swept across the eastern half of the USA this month, sending December temperatures to near-record cold levels all the way from Minneapolis to Miami. Blame it mainly on the North Atlantic Oscillation (NAO) and its close cousin, the Arctic Oscillation (AO). These large-scale climate patterns in the atmosphere over the Arctic and north Atlantic Ocean strongly affect winter weather. … Vikings recorded these effects nearly a thousand years ago, according to James Hurrell of the National Center for Atmospheric Research.” [http://www.usatoday.com/weather/forecast/2010-12-28-whysocold28_ST_N.htm]
Cleveland.com, Jan 9: “A bitter wind has been blowing over parts of North America, Europe and Asia. Some places have been colder than ever, like Melbourne, Fla., which dipped to 28 degrees last Thursday, a record low. Europe has been walloped by snowstorm after snowstorm. … This situation is caused by Arctic oscillation, in which opposing atmospheric pressure patterns at the top of the planet occasionally shift back and forth, affecting weather across much of the Northern Hemisphere.” [http://www.cleveland.com/nation/index.ssf/2010/01/arctic_oscillation_is_behind_a.html]
WHNT News, Jan. 18: “NASHVILLE, Tenn. (AP) — If you're looking for a culprit in a cold and snowy Tennessee winter, pin it on Arctic oscillation. The National Weather Service office in Nashville says that's a weather pattern in which atmospheric pressure at polar and middle latitude fluctuates between negative and positive phases.” [http://www.whnt.com/news/sns-bc-tn--winterweather,0,3729918.story]
But Al Gore, Feb 1: “it’s global warming”
|
|
NOAA – Record Snow Not Associated with Global Warming
NOAA’s Climate Scene Investigators (CSI) reported in March 2010 about the record snows of the winter 2009-2010. [http://www.climatewatch.noaa.gov/2010/articles/forensic-meteorology-solves-the-mystery-of-record-snows/all/1/] “They found no evidence — no human “fingerprints” — to implicate our involvement in the snowstorms. If global warming was the culprit, the team would have expected to find a gradual increase in heavy snowstorms in the mid-Atlantic region as temperatures rose during the past century. But historical analysis revealed no such increase in snowfall. Nor did the CSI team find any indication of an upward trend in winter precipitation along the eastern seaboard.”
Annual snowfall at Reagan National Airport site for 1888-89 through 2009-2010. The red bar shows the 55.9 inches accumulated through February 11, 2010 that broke the former record from 1898-99. Note that only 3 years of the last 20 have more than the long-term average of 15.2 inches of snow.
They attributed it to negative NAO plus El Nino. “When the NAO index is negative, or “blocked,” snow can pile up along the East Coast. At the atmospheric steering level for storms, high-pressure systems develop over Iceland and Greenland while low pressure builds over the central North Atlantic. This situation redirects the tracks of surface weather systems that are conducive for cold and snow toward the mid-Atlantic coast. Winter precipitation along the eastern seaboard is often in the form of rain, but in a blocked NAO pattern, temperatures can drop low enough to create snow instead. … In Baltimore and Washington, D.C., thirteen of the fifteen heaviest snowstorms since 1891 occurred when the NAO index was negative. And case studies of infamous Northeast U.S. storms over the last century, summarized in a Monograph of the American Meteorological Society, have discovered a link to blocked NAO conditions.”
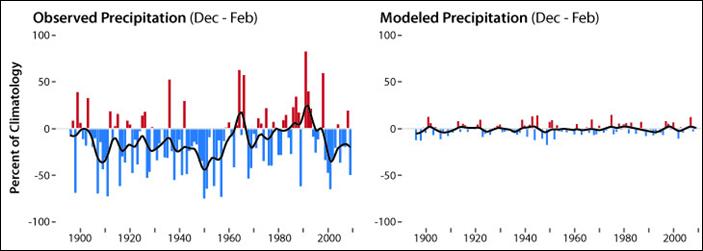
They also said this about climate models:
“The observed variations of winter precipitation in the Washington, D.C., area (left) have been very different from what models predict would occur if only human-induced emissions of greenhouse gas and aerosols (right) were taken into consideration. This evidence suggests the mid-Atlantic’s trends in precipitation are mainly due to natural variability, not human influence.”
|
|
For more details on the NAO and AO see: http://www.appinsys.com/GlobalWarming/AO_NAO.htm
|
|
|

