Global Warming Science - www.appinsys.com/GlobalWarming
The Solar Evidence
[last update: 2010/05/03]
|
The conclusion that the global warming in the latter part of the 20th century is a result of anthropogenic CO2, is based on computerized climate models (Global Circulation Models - GCMs) in which the models are only able to reproduce current global temperature trends only by increasing the CO2 levels. However there are problems with the models, including the lack of sensitivity to solar irradiance. Many scientists do not agree that the certainty exists in the models’ ability to forecast the future climate and many scientists present evidence that the models do not account for solar forcings that match reality. The IPCC (AR4) report (The Physical Basis of Climate Change, 2007 [http://ipcc-wg1.ucar.edu/wg1/wg1-report.html]) states that: “The direct RF [radiative forcing] due to increase in solar irradiance is reduced from the TAR [Third Assessment Report]. The best estimate is +0.12 [Watts per square metre]”. The problem is that it is not currently understood how this small amount of change in solar irradiance during the solar cycle can influence the earth’s climate. In addition the 4AR states: “There is more uncertainty regarding the influence of solar forcing. In addition to substantial uncertainty in the timing and amplitude of solar variations on time scales of several decades to centuries, which has increased since the TAR although the estimate of solar forcing has been revised downwards”. In the Technical Summary the IPCC states: “uncertainties remain large because of the lack of direct observations and incomplete understanding of solar variability mechanisms over long time scales”
In Chapter 9 of the IPCC AR4, they state: “A number of independent analyses have identified tropospheric changes that appear to be associated with the solar cycle (van Loon and Shea, 2000; Gleisner and Thejll, 2003; Haigh, 2003; White et al., 2003; Coughlin and Tung, 2004; Labitzke, 2004; Crooks and Gray, 2005), suggesting an overall warmer and moister troposphere during solar maximum. The peak-to-trough amplitude of the response to the solar cycle globally is estimated to be approximately 0.1°C near the surface. Such variations over the 11-year solar cycle make it is necessary to use several decades of data in detection and attribution studies. The solar cycle also affects atmospheric ozone concentrations with possible impacts on temperatures and winds in the stratosphere, and has been hypothesised to influence clouds through cosmic rays (Section 2.7.1.3). Note that there is substantial uncertainty in the identification of climate response to solar cycle variations because the satellite period is short relative to the solar cycle length, and because the response is difficult to separate from internal climate variations and the response to volcanic eruptions”
Thus due to the fact that the satellite record was (at the time the AR4 was written) less than 30 years and because the solar response is difficult to separate, it is excluded from the models.
A study published in 2003 (“Do Models Underestimate the Solar Contribution to Recent Climate Change?” by Peter Stott, Gareth Jones, and John Mitchell, Hadley Centre for Climate Prediction and Research, Met Office, United Kingdom, Journal of Climate December 2003) [http://climate.envsci.rutgers.edu/pdf/StottEtAl.pdf] States: “It is found that current climate models underestimate the observed climate response to solar forcing over the twentieth century as a whole, indicating that the climate system has a greater sensitivity to solar forcing than do models.”
|
|
The following figures are from the IPCC report Summary for Policy Makers (Feb 2007). Left - a) (from Fig SPM-4) compares decadal temperature averages (black line) with the result of model simulations. The lower (blue) band shows the results of 19 simulations from 5 climate models using only the natural forcings due to solar activity and volcanoes. The upper (pink) bands matching the temperature lines show the results of 58 simulations from 14 climate models using both natural and anthropogenic forcings. Right - b) (from Fig SPM-3) shows the global average temperature.
a) IPCC Temperature Modeling b) IPCC Temperature History
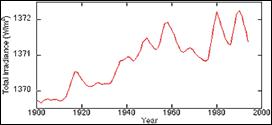
The following figure (left) is from the IPCC Physical Basis report (IPCC Figure 2.17) showing the total solar irradiance. The middle figure superimposes the model output figure (from above left), onto the relevant part of the total irradiance figure. The right-hand figure superimposes the historical global temperature (from above right) onto the relevant part of the total irradiance figure. The strong correlation between the solar irradiance trend and temperature with the poor correlation with the models based on solar irradiance shows the inability of the models to account for changes in solar irradiance, which IPCC erroneously assumes does not affect climate.
a) Total Solar Irradiance b) With IPCC Models c) With Temperature
|
|
The National Research Council (National Academy of Sciences) produced a study called “Climate Change Science: An Analysis of Some Key Questions” [http://books.nap.edu//html/climatechange/], which states: “Solar irradiance, the amount of solar energy striking Earth, has been monitored accurately only since the late 1970s. However, indirect measures of solar activity suggest that there has been a positive trend of solar irradiance over the industrial era… It is not implausible that solar irradiance has been a significant driver of climate during part of the industrial era, as suggested by several modeling studies.”
The sun provides the energy that warms the earth. And yet according to the NOAA National Climatic Data Center [http://www.ncdc.noaa.gov/oa/climate/globalwarming.html ] “Our understanding of the indirect effects of changes in solar output and feedbacks in the climate system is minimal”. The importance of fluctuations and trends in solar inputs in affecting the climate is inadequately modeled.
Although the sun exhibits varies types of energy related events (sunspots, solar flares, coronal mass ejections), sunspots have been observed and counted for the longest amount of time. Sunspots vary on an approximately 11-year cycle. The climate models assume that the solar irradiance varies by a negligible amount throughout the cycle. There is starting to be more disagreement as to this assumption. For example (Scafetta, N., and B. J. West, 2006. Phenomenological solar contribution to the 1900-2000 global surface warming. Geophysical Research Letters, doi: 1029/2005GL025539) state: “the models might be inadequate: (a) in their parameterizations of climate feedbacks and atmosphere-ocean coupling; (b) in their neglect of indirect response by the stratosphere and of possible additional climate effects linked to solar magnetic field, UV radiation, solar flares and cosmic ray intensity modulations; (c) there might be other possible natural amplification mechanisms deriving from internal modes of climate variability which are not included in the models”
|
|
Sunspots / Solar Irradiance
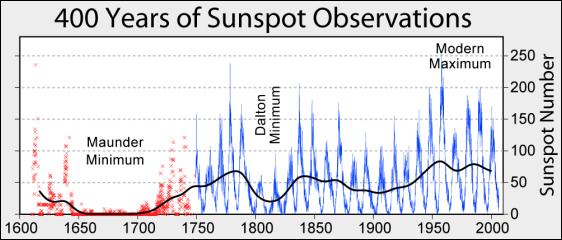
The following figures show historical sunspot data (Hoyt, D. V., and K. H. Schatten (1998a) – “Group Sunspot Numbers: A New Solar Activity Reconstruction”. Part 1. Solar Physics, 179, 189-219)
Sunspot Number over the Last 400 Years
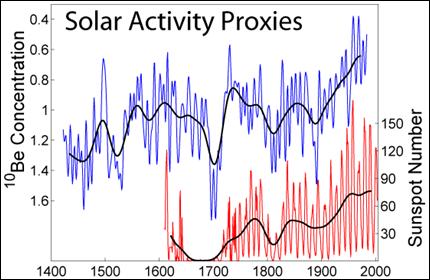
Sunspot Number and Solar Activity Proxy 1400 -2000
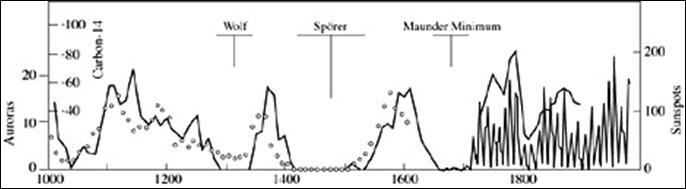
The following figure shows the longest-term data available representing the solar activity. “Three independent indices... The observed annual mean sunspot numbers (scale at right) also follows the 11-year solar activity cycle after 1700. The curve extending from 1000 to 1900 is a proxy sunspot number index derived from measurements of carbon-14 in tree rings. Increased carbon-14 is plotted downward (scale at left-inside), so increased solar activity and larger proxy sunspot numbers correspond to reduced amounts of radiocarbon in the Earth’s atmosphere. Open circles are an index of the occurrence of auroras in the Northern Hemisphere (scale at left-outside). (Courtesy of John A. Eddy.)” [Professor Kenneth R. Lang, Tufts University http://ase.tufts.edu/cosmos/view_picture.asp?id=119]
Sunspot Number and Solar Activity Proxy 1000 -2000
The following figure compares the solar proxy 10Be concentration with a combined with filtered temperature record of the northern hemisphere from Beer et al [“The role of the sun in climate forcing”, J. Beer, W. Mende, R. Stellmacher, Swiss Federal Institute of Environmental Science and Technology, Switzerland and Institute of Meteorology, Germany, Quaternary Science Reviews, 2000]. “If one computes the global and annual mean of solar forcing caused by the 100 kyr period of eccentricity one gets an amplitude of 0.12Wm~2 in the spherical mean. This value is too small to be detected in climate records. But, despite the tiny global forcing value, we can observe the 100 kyr frequency during the last 800 kyr in most paleoclimatic records. The global mean temperature changes between glacial and interglacial periods are large: about 20C for polar (Johnsen et al., 1995) and 5 for tropical regions (Stute et al., 1995). As a consequence the sensitivity for the 100 kyr Milankovitch forcing formally turns out to be about a 100 times larger than the values obtained from GCMs [emphasis added]. This result illustrates that using global and annual averages to estimate the climate sensitivity can be very misleading, especially when seasonal and local effects are significant. E.g. in the case of glaciers strong melting during the summer cannot be compensated by ice accumulation during the rest of the year. Beyond a certain threshold the winter temperatures have a vanishing influence on ice accumulation. So, constant small differences can be accumulated to large effects over long periods of time (10 kyr or half a period of the precessional cycle).”
Temperature and Solar Activity Proxy 1720 -2000
The following figure is from a 2006 paper by Beer et al [“Solar Variability Over the Past Several Millennia” J. Beer, M. Vonmoos and R. Muscheler (Swiss Federal Institute of Environmental Science and Technology, and NASA/Goddard Space Flight Center) Space Science Reviews, 2006, and shows the earth’s orbital eccentricity (panel (a) - the deviation from a circular orbit for the past 640,000 years with a clear period of ~100,000 years) and the corresponding sequence of glacial and interglacial periods found in the δD record from Dome C (Antarctica) (Spahni, 2005) that is an indicator of temperature shown in panel (b). The red curve in panel (b) reflects the summer insolation at 65◦N which includes, in addition to the eccentricity, the tilt angle (period of~40,000 years) and the precession of the Earth’s axis (period of ~20,000 years). “Note that the mean annual global insolation changes caused by the eccentricity are very small (<2.5 Wm−2)” and yet they cause significant climate changes. [http://www.eawag.ch/organisation/abteilungen/surf/publikationen/2006_solar_variability]] The paper states: “It is well known that the Sun plays the fundamental role as our energy source. However, it is still an open question what role the Sun plays in climate change… the observed changes of the TSI over an 11-year cycle are very small (0.1%), corresponding to an average temperature change of 1.5 K of the photosphere and, on Earth, to a global forcing change of 0.25 Wm−2 (averaging over the globe and taking into account the albedo of 30%). This led many people to conclude that, even if the solar constant is not constant, the changes are too small to be climatically relevant without invoking additional strong amplification mechanisms. This conclusion seems to be premature, firstly because there is no doubt that there are positive feedback mechanisms in the climate system. A cooling for example, leads to growing ice sheets which increases the albedo and thus the cooling. The existence of feedback mechanisms is illustrated by the discussed glacial-interglacial cycles that are related to a very weak annual mean change in insolation.”
a) Eccentricity b) Insolation and Temperature
A study done by an Assistant Professor of Earth Sciences at Dartmouth University [http://www.sciencedaily.com/releases/2002/06/020607073439.htm] looked at the cycles of the sun’s magnetic fluctuations and found: “the sun's magnetic activity is varying in 100,000-year cycles, a much longer time span than previously thought, and this solar activity, in turn, may likely cause the 100,000-year climate cycles on earth… Sharma's calculations suggest that when the sun is magnetically more active, the earth experiences a warmer climate, and vice versa, when the sun is magnetically less active, there is a glacial period. Right now, the earth is in an interglacial period (in between ice ages) that began about 11,000 years ago, and as expected, this is also a time when the estimated solar activity appears to be high” This 100,000-year cycle is evident in the above figure.
The following figure (left) is from a NASA study (Solar Variability, Ozone and Climate (Shindell 1999) [http://www.giss.nasa.gov/research/briefs/shindell_03/]) showing total solar irradiance 1900 – 1995. The study states: “The total energy change over a solar cycle is quite small, which has led many to argue that solar variability has little impact on climate.” However, a NASA study “NASA Study Finds Increasing Solar Trend That Can Change Climate” [http://www.giss.nasa.gov/research/news/20030320/] stated: “Since the late 1970s, the amount of solar radiation the sun emits, during times of quiet sunspot activity, has increased by nearly .05 percent per decade … Historical records of solar activity indicate that solar radiation has been increasing since the late 19th century. If a trend, comparable to the one found in this study, persisted throughout the 20th century, it would have provided a significant component of the global warming the Intergovernmental Panel on Climate Change reports to have occurred over the past 100 years”. The right-hand figure superimposes the NASA total irradiance (from left) on the IPCC (Feb. 2007) temperature plot (shown near the start of this document). This strong correlation illustrates the problem with the models – they need CO2 to accomplish a similar correlation since they do not consider solar irradiance.
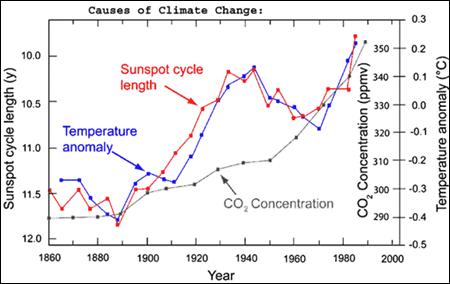
Although the sunspot cycle is approximately 11 years it varies and has generally been getting shorter over the last century. The following figure shows “Variations in the air temperature over land in the Northern Hemisphere (solid line) closely fit changes in the length of the sunspot cycle (dashed line). Shorter sunspot cycles are associated with increased temperatures and more intense solar activity. This suggests that solar activity is at least partly responsible for the rise in global temperatures over the last century” (Professor Kenneth R. Lang, Tufts University [http://ase.tufts.edu/cosmos/view_picture.asp?id=116])
Correlation of temperature change to sunspot activity cycle length
The fact that the temperature – sun correlation is better than the temperature – CO2 correlation indicates the deficiencies of the models in being able to account for the solar influence. Short cycles generate high sunspot maxima, whereas long cycles are characterized by weaker sunspot activity. Friis-Christensen and Lassen have shown that the close correlation extends back to the 16th century [Lassen, K. & Friis-Christensen, E.: “Variability of the Solar Cycle Length during the Past Five Centuries and the Apparent Association with Terrestrial Climate”, Journal of Atmospheric and Terrestrial Physics, 57 (1995)].
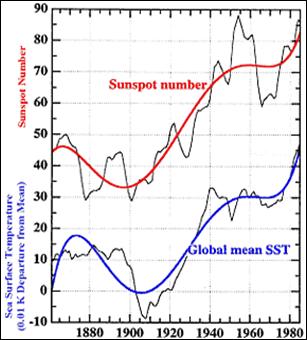
The NOAA web page called “The Sun-Climate Connection” provides the following figure (left). [http://www.research.noaa.gov/spotlite/archive/spot_sunclimate.html] A study by G. Tsiropoula (National Observatory of Athens, Institute for Space Applications and Remote Sensing, Athens, Greece) – “Signatures of solar activity variability in meteorological parameters” (Journal of Atmospheric and Solar-Terrestrial Physics 65 (2003) 469– 482) [http://zeus.nascom.nasa.gov/~bfleck/jastp_publ.pdf ] provides further regional correlations between the sun and SST’s as shown in the figure below right.. He makes the statement “physical processes and/or linking mechanisms for this association are as yet unclear … current GCM simulations do not attribute a special role to the solar input variations on the climate change of the 20th century”. Both of these sources reference “Reid 1999” – this refers to “Reid, G.C., 1999. ‘Solar variability and its implication for the human environment’. (Journal of Atmospheric and Solar Terrestrial Physics 61, 3–14.)” “The globally averaged sea surface temperatures are plotted with the sunspot numbers (Reid; 1999). Both sunspot number and solar cycle length are proxies for the amount of solar energy that Earth receives. The similarity of these curves is evidence that the sun has influenced the climate of the last 150 years”
A study by S.K. Solanki and M. Fligge (Institute of Astronomy, ETH-Zentrum, CH-8092 Z¨urich, Switzerland) -- “A reconstruction of total solar irradiance since 1700” (GEOPHYSICAL RESEARCH LETTERS, VOL. 26, NO. 16, PAGES 2465-2468, AUGUST 15, 1999) [http://www.acrim.com/Reference%20Files/Solanki%20&%20Fligge_A%20reconstruction%20of%20total%20solar%20irradiance%20since%201700_1999GL900370.pdf] provides the correlation graph shown in the following figure.
Eleven-year running mean of Thin solid curve: solar cycle length; thin dashed curve: sunspot number, thick solid curve: northern hemisphere land temperature anomaly
A study by Claus Frohlich and Judith Lean (World Radiation Center, Switzerland and E.O. Hulburt Center for Space Research, Naval Research Laboratory, Washington, DC) “Solar Radiative Output and its Variability: Evidence and Mechanisms” (Astronomy and Astrophysics Review) [http://rivernet.ncsu.edu/courselocker/PaleoClimate/FrohlichLeanSolIrdOverview1.pdf ] displays the figure shown below (left). The right-hand figure superimposes the IPCC temperature graph (shown near the start of this document, changed to orange), showing the strong correlation.
a) Total Solar Irradiance b) Temperature Superimposed
The following figure is from a United Nations Food and Agriculture Organization paper [ftp://ftp.fao.org/docrep/fao/006/y5028e/y5028e01.pdf].
Solar Irradiance (UN Food and Agriculture Organization)
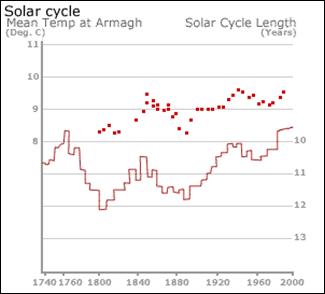
A study by scientists at Armagh Observatory (Ireland) “Sun's warming influence 'under-estimated'” says that the sun has been the main contributor to global warming over the past two centuries. [http://news.bbc.co.uk/2/hi/science/nature/1045327.stm ] “The researchers point out that the mean average temperature at Armagh seems to be related to the length of the Sun's activity cycle. This cycle is on average 11 years in duration but it can vary a few years either way. “We have found that it gets cooler when the Sun's cycle is longer and that Armagh is warmer when the cycle is shorter," said Dr Butler. In general, the more cosmic rays that reach the Earth, the more low cloud there is. However, a higher solar activity leads to lower cosmic ray flux and reduced low cloud. Low clouds cool the Earth by reflecting more solar radiation back into space, so a drop in the amount of low cloud contributes to global warming. High cloud does the opposite and tends to warm the Earth by reflecting more of the Earth's infra-red radiation back to the ground.” The following figure from the study.
Solar Cycle Length and Temperature at Armagh
The following figure compares United States annual mean temperatures with the solar cycle length. [http://www.uoguelph.ca/~rmckitri/research/intellicast.essay.pdf]
Solar Cycle Length and US Mean Temperature
The following figure is from a 2004 study “Unusual activity of the Sun during recent decades compared to the previous 11,000 years”, S.K. Solanki, I. G. Usoskin, B. Kromer, M. Schüssler, and J. Beer, (Max-Planck-Institut für Sonnensystemforschung, Germany, Sodankylä Geophysical Observatory, Finland, Heidelberger Akademie der Wissenschaften, Germany, Department of Surface Waters, Switzerland) -- Nature, Vol. 431, No. 7012, pp. 1084 - 1087, 28 October 2004) [http://www.ncdc.noaa.gov/paleo/pubs/solanki2004/solanki2004.html] in which the authors state “the level of solar activity during the past 70 years is exceptional, and the previous period of equally high activity occurred more than 8,000 years ago. We find that during the past 11,400 years the Sun spent only of the order of 10% of the time at a similarly high level of magnetic activity and almost all of the earlier high-activity periods were shorter than the present episode.”
Sunspot Reconstruction for Past 11,000 Years (blue) With Recent Measured Sunspot (red)
A 2005 study of the effects of solar irradiance on Arctic temperatures (Soon, W.H., "Variable Solar Irradiance as a Plausible Agent for Multidecadal Variations in the Arctic-wide Surface Air Temperature Record of the Past 130 Years," Geophysical Research Letters, Vol. 32, 2005 [http://www.agu.org/pubs/crossref/2005/2005GL023429.shtml] showed that there is a much stronger correlation between temperatures and solar irradiance than with CO2, as shown in the following figure.
Correlation of Arctic Temperatures With Solar Irradiance (left) and CO2 (right)
The following figure is from a recent study: “Surface warming by the solar cycle as revealed by the composite mean difference projection” (Charles D. Camp and Ka Kit Tung, Department of Applied Mathematics, University of Washington, Geophysical Research Letters, VOL. 34, 2007) [http://www.amath.washington.edu/~cdcamp/Pub/Camp_Tung_GRL_2007b.pdf] showing a strong correlation between solar irradiance and temperature. The authors state: “the observed correlation of the spatially filtered surface temperature with the 11-year solar cycle is statistically significant at 99.8% confidence level”. The next right-hand figure compares the global CO2 measurements (center) with the left-hand figure, illustrating the relative lack of correlation between CO2 and temperature.
|
|
Magnetic Field
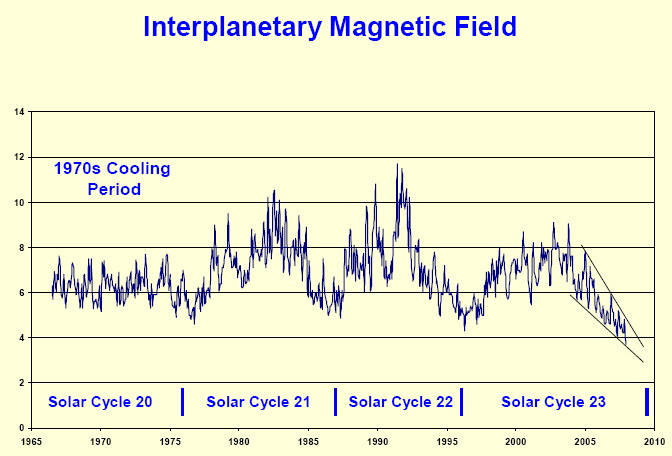
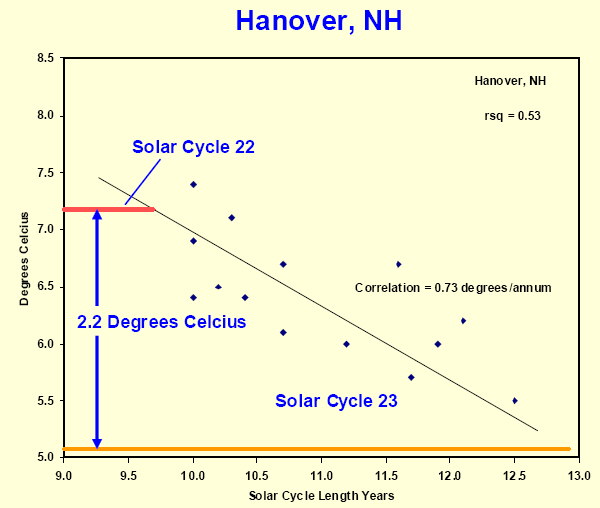
David Archibald has written an analysis of recent sunspot cycles describing the relationship between the solar cycles and the influence on the interplanetary magnetic field and temperatures on Earth. He also provides an analysis of the inverse correlations between the solar cycle length and temperatures at various climate stations. See www.warwickhughes.com/agri/Solar_Arch_NY_Mar2_08.pdf for more details on the expected solar cycle 24 cooling. The figures below show the interplanetary magnetic field (left) and the relationship between solar cycle length and temperature for Hanover NH (right).
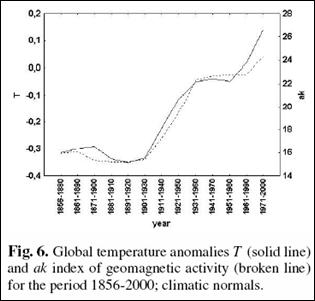
A paper by El-Borie and Al-Thoyaib called “Can we use the aa geomagnetic activity index to predict partially the variability in global mean temperatures?” (International Journal of Physical Sciences Vol. 1 (2), pp. 067-074, October, 2006 [http://www.academicjournals.org/IJPS/PDF/Pdf2006/Oct/El-Borie%20and%20Al-Thoyaib.pdf] states: “Near-Earth variations in the solar wind, measured by the aa geomagnetic activity index, have displayed good correlations with global temperature (Landscheidt, 2000). Lockwood et al. (1999) found that the total magnetic flux, leaving the Sun and driven by the solar wind, has risen by a factor 2.3 since 1901, leading to the global temperature increased of 0.5º C. In addition, the solar energetic eruptions, which dragged out or/and organized by the observed variations in the solar wind, are closely correlated with the near-Earth environment (El-Borie, 2003a;b). Comparison of the aa geomagnetic with the solar wind, post-1965, showed a fairly good match, indicating that the aa variations were mostly due to similar variations in the solar wind, which must have their origin in solar physical processes (Feynman, 1982; Kane, 1997; El-Borie, 2003a;b).”
For more details on the aa index see: http://www.appinsys.com/GlobalWarming/AAIndex.htm
A 2003 PhD thesis (Palmara: “Solar Activity and Recent Climate Change: Evaluating the Impact of Geomagnetic Activity on Atmospheric Circulation”, University of Wollongong [http://www.library.uow.edu.au/adt-NWU/uploads/approved/adt-NWU20040924.142821/public/01Front.pdf]) stated: “Solar-modulated geomagnetic activity is therefore an important forcing mechanism for recent climate change. Specifically, many of the unexplained aspects of the recent changes in northern hemisphere climate, including the climate regime shift of the early 1960s, can be attributed to the effects of geomagnetic activity in the upper atmosphere. Interannual variations in the North Atlantic Oscillation should no longer be considered as ‘climatic noise’, while the strong positive trend and decadal variations evident since the 1960s can be attributed, in part, to solar forcing.”
A 2004 study (Ponyavin: “Solar Cycle Signal in Geomagnetic Activity and Climate”, Solar Physics Journal 2004, [http://www.springerlink.com/content/v14nq055046v20u8/]) states: “Historical geomagnetic and climate records were analyzed to study long-term trends and relationships with solar activity. … It is shown that the solar cycle signal is more pronounced in climatic data during the last 60 years.”
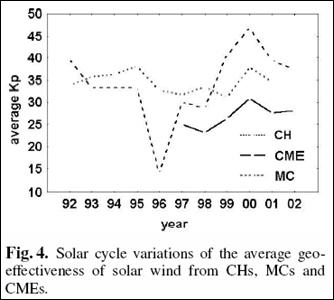
A 2005 study (Georgieva, Bianchi and Kirov: “Once Again About Global Warming and Solar Activity”, Mem. Societa Astronomica Italiana, Vol 76, 2005 [http://sait.oat.ts.astro.it/MSAIt760405/PDF/2005MmSAI..76..969G.pdf]) states: “We show that the index commonly used for quantifying long-term changes in solar activity, the sunspot number, accounts for only one part of solar activity and using this index leads to the underestimation of the role of solar activity in the global warming in the recent decades. A more suitable index is the geomagnetic activity which reflects all solar activity, and it is highly correlated to global temperature variations in the whole period for which we have data.” The study examined the geoeffectiveness of coronal mass ejections (CME) separated into two types – magnetic cloud (MC) and non-MC CMEs (CME), and coronal holes (CH). The following figures are from their study. Their conclusion: “the sunspot number is not a good indicator of solar activity, and using the sunspot number leads to the under-estimation of the role of solar activity in the global warming”
A study of solar magnetic clouds during 1994 - 2002 by Wu, Lepping & Gopalswamy, “Solar Cycle Variations of Magnetic Clouds and CMEs” [http://www.scostep.ucar.edu/archives/scostep11_lectures/Pap.pdf] states: “The average occurrence rate is 9 magnetic clouds per year for the overall period (68 events/7.6 years). It is found that some of the frequency of occurrence anomalies were during the early part of Cycle 23: 1. Only 4 magnetic clouds were observed in 1999, and 2. An unusually large number of magnetic clouds (16 events) were observed in 1997 in which the Sun was beginning the rising of Cycle 23.” This “unusually large number of magnetic clouds” may have been the trigger of the significant 1997-98 El Nino.
A 2008 study at the University of Naples, Italy (“Solar Forcing of Changes in Atmospheric Circulation, Earth’s Rotation and Climate”, Open Atmospheric Science Journal, 2008) found that there is a strong correlation between the following providing the solar connection: the external geomagnetic activity index (aa) -> the integrated zonal wind (IZI) -> Earth length of day (LOD) -> sea surface temperatures (SST). The conclusion states: “A large portion of global warming was explained here in terms of turbulence of solar wind, atmospheric circulation and Earth’s rotation. At the basis of the model is the idea of a coherent whole with an integrated mechanism encompassing the whole Earth-atmosphere-Sun system. If the solar corpuscular activity behaves in the same way in the future as in the past, its 60-yr cycle might suggest a forecast estimate for a gradual cooling of the Earth’s atmosphere in this decade.” [http://www.meteo.unina.it/download/solar_forcing.pdf]
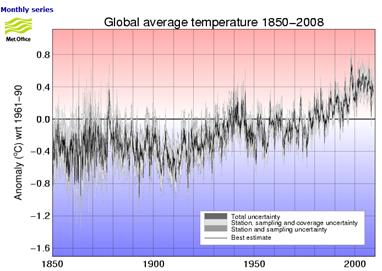
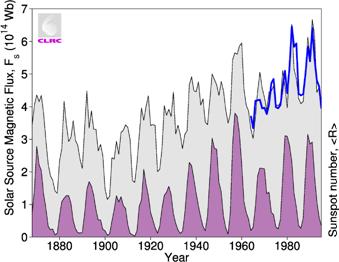
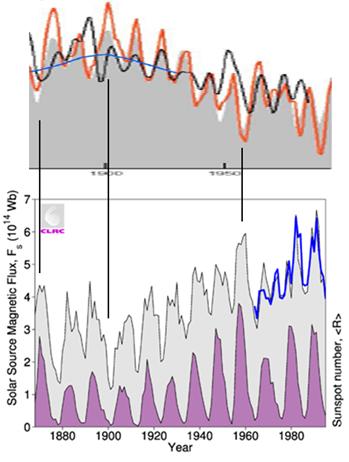
The following figures show the global average temperature from 1850 – 2008 (left) [http://hadobs.metoffice.com/hadcrut3/diagnostics/global/nh+sh/], and (right) the total solar magnetic flux (black line bounding grey shading and blue line) along with the annual sunspot number (shaded purple). The solar figure is from M. Lockwood, R. Stamper, and M.N. Wild: “A Doubling of the Sun's Coronal Magnetic Field during the Last 100 Years”, Nature Vol. 399, 3 June 1999 [http://www.ukssdc.ac.uk/wdcc1/papers/nature.html]) which states: “The magnetic flux in the solar corona has risen by 40% since 1964 and by a factor of 2.3 since 1901.”
The following figure superimposes the global temperature (from above left – changed to red) on the solar flux (from above right).
See also http://www.appinsys.com/GlobalWarming/EarthMagneticField.htm for a detailed look at the Earth’s magnetic field.
|
|
Cosmic Rays
A study done by the director of the Centre for Sun-Climate Research at the Danish Space Research Institute (DSRI) [http://www.canada.com/nationalpost/news/story.html?id=d2113c58-030a-4390-a12c-30f45d75dfa5&p=1] looked at the influence of the sun’s magnetic field on cosmic rays and cloud formation and found: “The sun and the stars could explain most if not all of the warming this century, and he has laboratory results to demonstrate it. Dr. Svensmark's study had its origins in 1996, when he and a colleague presented findings at a scientific conference indicating that changes in the sun's magnetic field -- quite apart from greenhouse gases -- could be related to the recent rise in global temperatures….Svensmark and his colleague had arrived at their theory after examining data that showed a surprisingly strong correlation between cosmic rays and low-altitude clouds. Earth's cloud cover increased when the intensity of cosmic rays grew and decreased when the intensity declined…. Dr. Svensmark has never disputed the existence of greenhouse gases and the greenhouse effect. To the contrary, he believes that an understanding of the sun's role is needed to learn the full story, and thus determine man's role. Not only does no climate model today consider the effect of cosmic particles, but even clouds are too poorly understood to be incorporated into any serious climate model.”
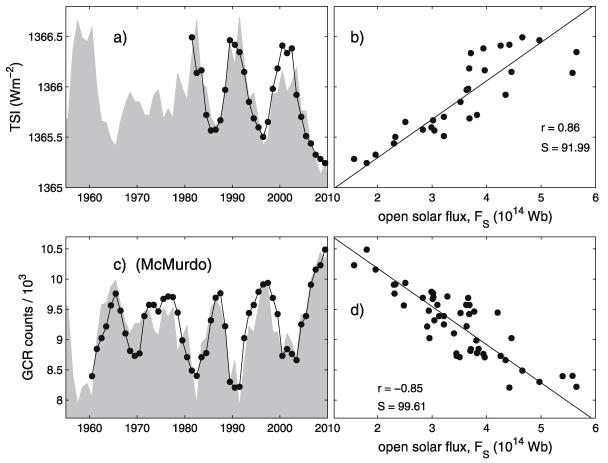
The following figure is from a study published in 2010 (Lockwood et al, “Are cold winters in Europe associated with low solar activity?”) [http://iopscience.iop.org/1748-9326/5/2/024001/fulltext]: “Figure 1 shows that Fs [open solar magnetic flux] is highly anticorrelated with cosmic ray fluxes and also correlates very well (with a lag of 1 year) with total solar irradiance (TSI). These correlations are at the centre of a relationship between TSI and solar-modulated cosmogenic isotopes, which is conventionally assumed in palaeoclimate studies. As well as yielding both the lowest Fs and TSI seen during the space age, the current solar minimum has seen an unprecedented maximum in cosmic rays detected by high-latitude neutron monitors.”
While some climate scientists deny the cosmic ray – cloud connection, a study done at the State University of New York [http://www.newscientist.com/article/mg17523551.900-cosmic-rays-and-newborn-clouds-explain-one-of-the-mysteries-of-global-warming.html ] found that: "The solar wind... deflects cosmic rays. As the sun becomes more active and the solar wind intensifies, the theory predicts fewer cosmic rays should reach the earth and less cloud should form. Data from the past 20 years backs this up: as the sun has become more active, low-altitude cloud cover has dropped."
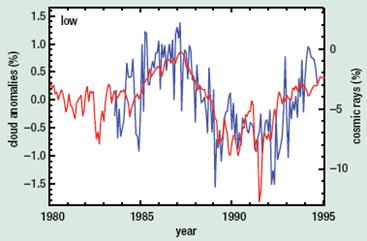
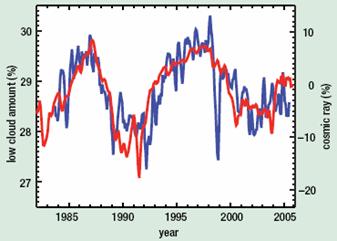
The following figures compare cosmic rays (red) and the low atmosphere global cloud cover [http://www.spacecenter.dk/research/sun-climate/Scientific%20work%20and%20publications/resolveuid/86c49eb9229b3a7478e8d12407643bed]
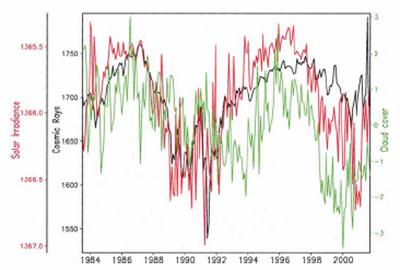
The following figure adds the inverted plot of solar irradiance (red) to the cloud and cosmic ray data shown above, showing a correlation with solar irradiance [http://folk.uio.no/jegill/papers/kkk_asr_2004.pdf]
The UN periodically produces an assessment of the worldwide ozone depletion. The most recent report: WMO/UNEP: “Scientific Assessment of Ozone Depletion: 2006” by the Scientific Assessment Panel of the Montreal Protocol on Substances that Deplete the Ozone Layer [http://www.wmo.ch/pages/prog/arep/gaw/reports/ozone_2006/pdf/exec_sum_18aug.pdf] states: “at some midlatitude stations in the Northern Hemisphere, surface UV irradiance continued to increase at rates of a few percent per decade. The observed increases and their significance depend on location, wavelength range, and the period of measurements. These increases cannot be explained solely by ozone depletion and could be attributed to a decreasing tendency in aerosol optical extinction and air pollution since the beginning of the 1990s and partly to decreasing cloudiness, as estimated from satellites”.
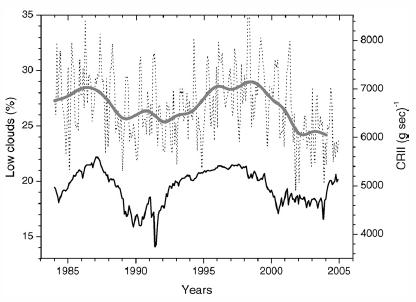
The following figure is from Usoskin & Kovaltsov: “Cosmic Rays and Climate of the Earth: Possible Connection”, C.R. Geoscience 340 (2008) [http://cc.oulu.fi/~usoskin/personal/usoskin_CR_2008.pdf] and compares low cloud cover and cosmic ray intensity (CRI): “A link between low clouds and CR appears statistically significant on the interannual time scale since 1984 in limited geographical regions, the largest being North Atlantic + Europe and South Atlantic”
The following figure shows the correlation between sun spot cycle, galactic cosmic rays, and global cloudiness [http://www.tcsdaily.com/article.aspx?id=010405M]. Increased solar activity deflects cosmic rays away from the earth. “when cosmic rays are deflected away from the Earth there are fewer clouds, which permits a little bit more secondary radiation to penetrate to the surface. Thus we no longer have the problem caused by solar variability only varying by 0.1% through a sunspot cycle, the change in global cloudiness permits more than ample solar energy through, which can significantly change climate. There is now a viable explanation to explain the great correlation that has been observed between solar records and temperature records. The correlation gets even better through longer-scale solar cycles. For example, the intensity of cosmic rays varies by 15 percent through the 11-year sun spot cycle. At the longer wavelength decadal-scale Gleissberg, centennial-scale Seuss, and millennial-scale Bond cycles the cosmic ray intensity varies by up to four times that much, causing significant changes to the climate.”
Correlation of Solar Irradiance and Cosmic Rays with Low Cloud Cover
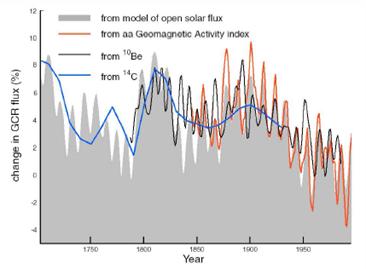
The following figure shows the change in global cosmic ray flux (GCR) from four independent proxies (left) showing the decrease in GCR throughout the 1900s. [http://meteo.lcd.lu/globalwarming/Gray/Influence_of_Solar_Changes_HCTN_62.pdf] The right-hand figure compares the same data with the solar magnetic flux shown previously, showing the correlation between the solar magnetic flux and the cosmic ray flux. The figures above and below indicate a strong correlation between the solar magnetic flux, the cosmic ray flux, and the global temperatures.
|
|
Empirical Studies of Solar Irradiance and Climate At Specific Geographic Locations
The following figure shows the solar irradiance since 1980 (From Figure 2.16 in the IPCC 4AR Scientific Basis report).
Solar Irradiance 1980 – 2005 from IPCC AR4 Figure 2.16
The next figures show (left) the temperature at Hilo (nearest station to Mauna Loa) since 1970, as well as combining the solar irradiance (lagged by 3 years) with the CO2 from Mauna Loa. As can be seen, the solar irradiance provides a much better correlation with temperature than does the CO2.
Left: Hilo Temperature (NOAA GHCN data), and Right: Temperature (blue) Combined with Solar Irradiance (green / magenta) and Mauna Loa CO2 (black)
Oregon, USA - Temperature
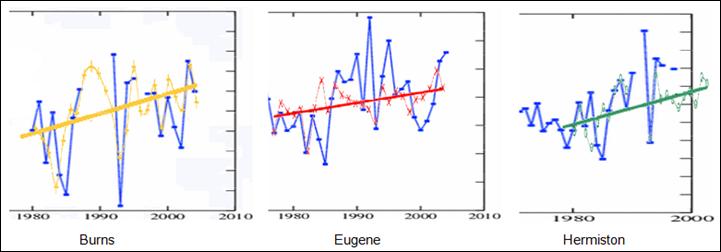
A study of solar irradiance at three locations in Oregon (“Trends In Direct Normal Solar Irradiance In Oregon From 1979-2003”, Laura Riihimaki and Frank Vignola, Department of Physics, University of Oregon [http://solardat.uoregon.edu/download/Papers/DirectNormalTrends.pdf] provides data showing a strong correlation between temperature and solar irradiance. The following figure is from the study.
Solar Irradiance For Three Locations in Oregon
Using temperature graphs from the NASA GISS database, and superimposing the above irradiance data yields the graphs shown in the following figure showing the strong correlation between solar irradiance and temperature (details can be found at www.appinsys.com/GlobalWarming/solar_oregon.htm).
Solar Irradiance Superimposed on Temperature for the Oregon Locations
Funafuti, Tuvalu – Sea Level
The Australian Agency for International Development has set up sea level stations (SeaFrame) at several islands in Oceania, with data starting in 1993. [http://www.bom.gov.au/ntc/IDO60033/IDO60033.2006.pdf] As part of the sea level monitoring, they also measure sea temperature. The following figure is from the Funafuti, Tuvalu station showing mean, minimum and maximum sea temperatures.
The next figure combines the WM 2003 satellite solar irradiance data from the IPCC graph (shown previously) lagged by 3 years with the sea level data shown above.
United Kingdom – Temperature
The UK Meteorological Office published a summary of UK climate trends in 2006 [http://www.metoffice.gov.uk/climate/uk/about/UK_climate_trends.pdf], which states: “Winter and autumn sunshine has increased very significantly for northern, central and south-east England since 1929… Most of the increase has taken place since the late 1960’s.” The following figures show annual smoothed temperatures and sunshine hours by district.
The next figure shows the temperature data from above plus two of the sunshine data lines from above, for 1960 to 2004. The two comparison curves are for “SE & Central S Eng” and “E & NE England”. Most of the temperature curves show similar almost exact correspondence with sunshine. The averaged regional temperature shows a better correlation with solar than with CO2.
Mt Rainier, Washington, USA – Temperature
Mt Rainier is the tallest mountain in the Pacific Northwest USA. The Longmire station is the closest station in the US Historical Climate Network. The following figure compares the average annual temperature at Longmire with the UN FAO solar irradiance figure shown previously as well as in the lower right below. The correlation with solar irradiance is clear.
The following figures show the gridded temperature data for the 5x5 grid including western Washington [left] and combined with the solar irradiance data [right]. While the atmospheric CO2 has been increasing continuously throughout this period, the correlation between solar irradiance and temperature is stronger.
|
|
Solar Effect on Stream Flow
Numerous empirical studies have shown a strong correlation between the solar cycle and stream flow. A few examples are given below.
Lake Victoria, Africa
A recent South African technical paper by a Professor Emeritus of the Department of Civil and Biosystems Engineering of the University of Pretoria, and other engineers (“Linkages Between Solar Activity, Climate Predictability and Water Resource Development” by W J R Alexander, F Bailey, D B Bredenkamp, A van der Merwe and N Willemse Journal of the South African Institution of Civil Engineering, Vol. 49 No 2, June 2007) provides evidence of the relationship between solar activity and hydrological events [http://nzclimatescience.net/images/PDFs/alexander2707.pdf]. The following figure is from their paper, showing the correlation between sunspot number and lake level for Lake Victoria, Africa. This link between sunspot cycle and climate has been confirmed by a new study showing that sunspot cycles can be used to predict heavy rains, flooding and subsequent disease outbreaks in East Africa. [http://www.nsf.gov/news/news_summ.jsp?cntn_id=109789].
Correlation Between Sunspot Number and Lake Level for Lake Victoria, Africa
Mississippi River, USA
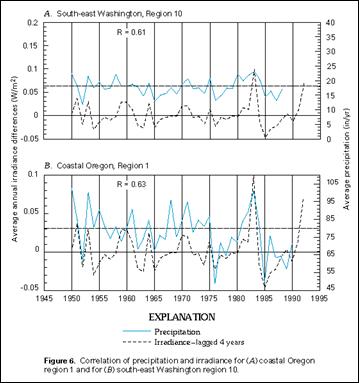
A study by Charles A. Perry (Water Resources Division, U.S. Geological Survey, Lawrence, Kansas USA) “Solar-Irradiance Variations and Regional Precipitations in the Western United States” [http://ks.water.usgs.gov/Kansas/waterdata/climate/homepage.ijc.html] provides correlations between the sun and localized climatic effects such as precipitation and stream flow. The following figures show the effects on precipitation in Washington and Oregon (left) and stream flow of the Mississippi River at St. Louis, Missouri with solar irradiance variations lagged 5 years (right). These correlations provide further evidence of a strong influence of solar input on climate.
Parana River, South America
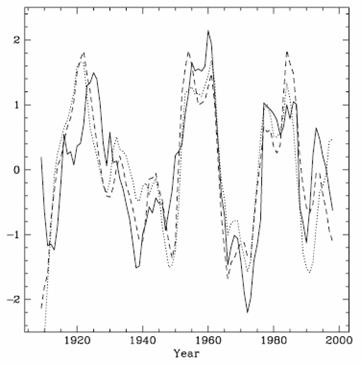
A study of the correlation between the Parana River stream flow and sunspot number was published in 2008 (“Solar Forcing of the Stream Flow of a Continental Scale South American River”, Pablo J. D. Mauas, Eduardo Flamenco, Andrea P. Buccino, Instituto de Astronomı´a y Fı´sica del Espacio, Buenos Aires, Argentina, Physical Review Letters 101, 2008 [http://www.iafe.uba.ar/httpdocs/reprint_parana.pdf]). They analyzed the stream flow data measured at a gauging station in the city of Corrientes, 900 km north of the outlet of the Parana. It has been measured continuously from 1904, on a daily basis. Their conclusion: “on the multidecadal time scale, we found a strong correlation with solar activity, as expressed by the sunspot number, and therefore probably with solar irradiance, with higher activity coincident with larger discharges; on the yearly time scale, the dominant correlation is with El Nino.” The following figure is from their paper and shows the detrended time series for the Parana’s stream flow (solid line), the sunspot number (dashed line), and the irradiance reconstruction (dotted line). (The data were smoothed by an 11-yr running mean to smooth out the solar cycle, and normalized by subtracting the mean and dividing by the standard deviation.)
Australia
Research published in 2006 by Associate Professor Robert Baker from The University of New England, Australia: “Sunspot cycles a key to drought prediction” [http://www.une.edu.au/news/archives/000535.html] states: “The most well-known sunspot cycle is the 11-year cycle, which comprises alternating five-and-a-half-year periods of relatively high and low sunspot activity. Once every 11 years, too, there is a sudden reversal of the polarity of the Sun’s magnetic field, so that there is a complete magnetic cycle (the Hale cycle) every 22 years. Dr Baker’s model, which incorporates all these factors, indicates that south-eastern Australia - much of it currently drought-affected - could be heading for a period of even lower rainfall. This is because of an imminent coincidence of several of the solar cycles. The sunspot minimum in the 11-year cycle due in August this year coincides with that phase of the Hale cycle in which the magnetic field lines emerge from the Sun’s south pole. Dr Baker said historical records showed that this coincidence was associated with reduced sunspot minima, and more severe droughts in eastern Australia.”
|
|
Mars
The planet Mars is also exhibiting a warming trend. A recent National Geographic article [http://news.nationalgeographic.com/news/2007/02/070228-mars-warming.html] states: “Simultaneous warming on Earth and Mars suggests that our planet's recent climate changes have a natural—and not a human-induced—cause…. Habibullo Abdussamatov, head of space research at St. Petersburg's Pulkovo Astronomical Observatory in Russia, says the Mars data is evidence that the current global warming on Earth is being caused by changes in the sun. "The long-term increase in solar irradiance is heating both Earth and Mars," he said.” A lack of long term data on Mars prevents definitive knowledge, but William Feldman of the Los Alamos National Laboratory (involved with NASA's Mars Odyssey orbiter) says “One explanation could be that Mars is just coming out of an ice age” [http://www.space.com/scienceastronomy/mars_ice-age_031208.html]. The principal investigator for the Mars Orbiter Camera said: “The images, documenting changes from 1999 to 2005, suggest the climate on Mars is presently warmer, and perhaps getting warmer still, than it was several decades or centuries ago just as the Earth experienced its own ice ages.” [http://www.abc.net.au/science/news/stories/2005/1464931.htm]
|
|
See also:
Geomagnetic aa index: http://www.appinsys.com/GlobalWarming/AAIndex.htm
|
|
|