Global Warming Science: www.appinsys.com/GlobalWarming
AA Planetary Geomagnetic Index
[last update: 2010/12/29]
|
AA Index
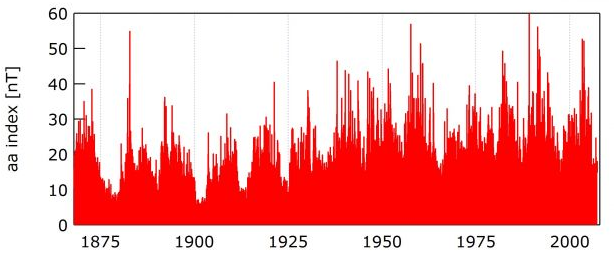
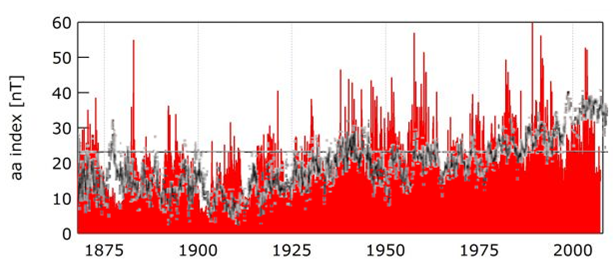
The aa index is a measure of the disturbance level of the Earth’s magnetic field based on magnetometer observations at two nearly antipodal stations: Hartland observatory in the UK and Canberra observatory in Australia. The following figure shows the aa index since 1868. [http://roma2.rm.ingv.it/en/themes/23/geomagnetic_indices/24/aa_planetary_index]
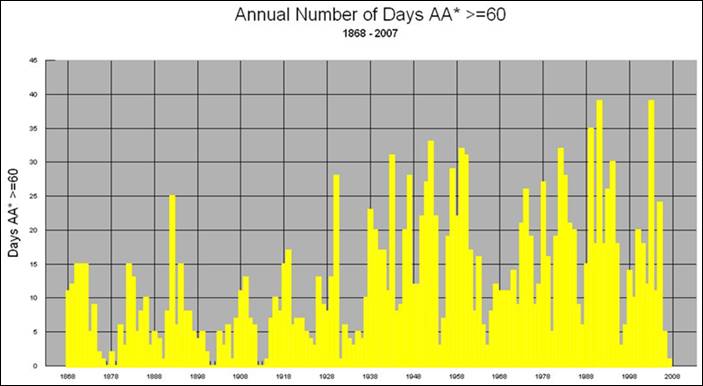
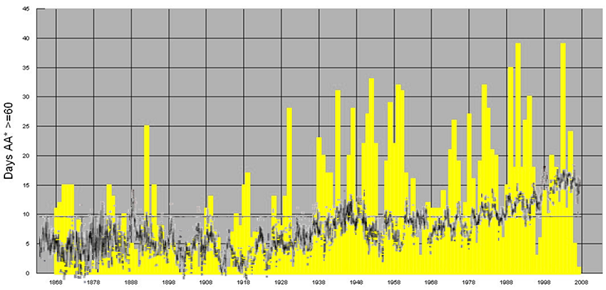
A NOAA National Geophysical Data Center website states “the overall level of magnetic disturbance from year to year has increased substantially from a low around 1900 Also, the level of mean yearly aa is now much higher so that a year of minimum magnetic disturbances now is typically more disturbed than years at maximum disturbance levels before 1900.” [bold emphasis in original] The following figure is from that website. [http://www.ngdc.noaa.gov/stp/geomag/aastar.html]
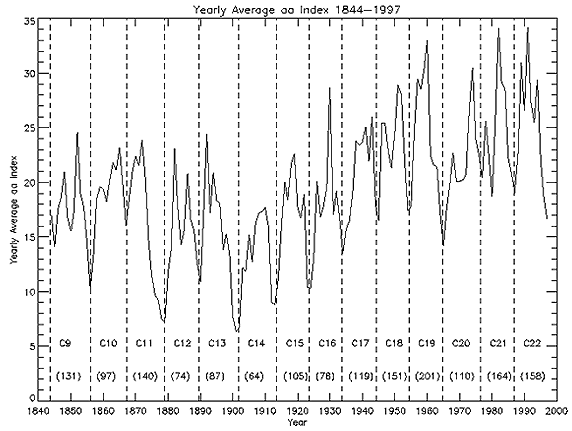
The following figure shows the yearly average aa index along with vertical dashed lines indicating the solar cycles, for 1844 - 1997 [http://www.ips.gov.au/Educational/3/1/4]
|
|
AA Relationship to Temperature
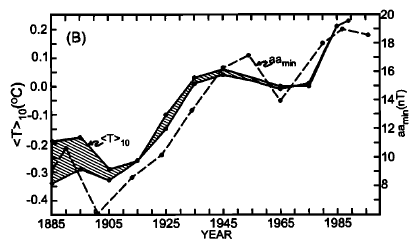
A 1998 paper (Cliver et al, “Solar variability and climate change: Geomagnetic aa index and global surface temperature”, Geophysical Research Letters, Vol.25, 1998) states: “During the past ~120 years, Earth's surface temperature is correlated with both decadal averages and solar cycle minimum values of the geomagnetic aa index. The correlation with aa minimum values suggests the existence of a long-term (low-frequency) component of solar irradiance that underlies the 11-year cyclic component. Extrapolating the aa-temperature correlations to Maunder Minimum geomagnetic conditions implies that solar forcing can account for ~50% or more of the estimated ~0.7-1.5°C increase in global surface temperature since the second half of the 17th century.” [http://ruby.fgcu.edu/courses/twimberley/EnviroPhilo/Cliver.pdf]
The following figure is from the above paper showing “Comparison of solar cycle minimum values of the geomagnetic aa index(aamin) and (< T >) from 1880-1990”
The same paper states: “The correlation we find between the aa baseline and terrestrial surface temperature suggests the existence of a long-term (low-frequency) component of solar irradiance that tracks the average level of geomagnetic (sunspot) activity. In this view, the absence of pronounced 11-year temperature fluctuations is attributed to the damping effect of the thermal inertia of the oceans.”
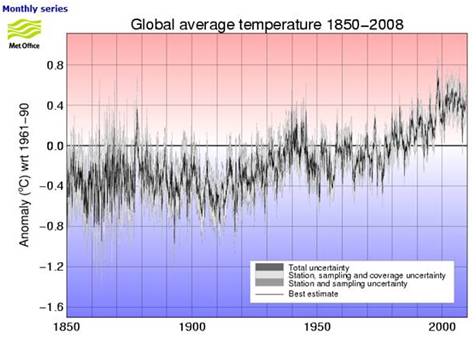
The following figure shows the Hadley Climatic Research Unit global average temperature anomalies through 2008 (from [http://hadobs.metoffice.com/hadcrut3/diagnostics/global/nh+sh/]).
The following figures show the temperature from above plotted relative to the aa minima.
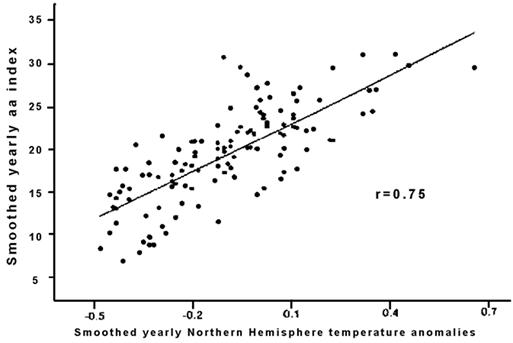
The following figure shows “plot of yearly means of the geomagnetic aa index and Northern Hemisphere land air and sea surface temperature anomalies 1868 -1998. The aa data are shifted to offset a 6-year lag of temperature.” [http://www.mitosyfraudes.org/Calen/SolarWind.html]
A 2009 paper, Bucha: “Geomagnetic Activity and the Global Temperature” [http://www.springerlink.com/content/c071v0t195182757/] states: “We are able to establish the key fact that there exist statistically significant relations between the increasing global temperature and geomagnetic activity in the month of October and December … As a consequence of geomagnetic storms, indicating the enhancement of the solar wind, energetic particles penetrate from the magnetosphere into the region of the polar vortex. There they take part in perturbing the processes in the polar region and in changing the direction of the flow of the polar air to the lower latitudes.” And “At the time of La Nina and under low values of the AA index, the wind blows from the polar region over North America and from the Atlantic towards the pole via Greenland. Surface temperatures in Eurasia are below normal. Under El Nino and increased values of the AA index, the vortex shifts towards Europe and rotates couterclockwise. … This leads to the increase of surface temperatures in Eurasia and increases the global temperature.”
|
|
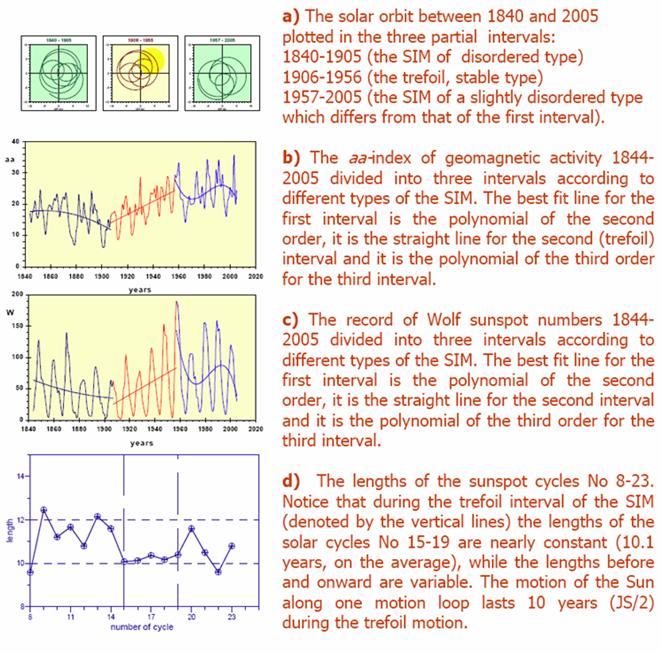
AA Relationship to Solar Inertial Motion
The following figure is from [http://geomag.usgs.gov/iagaxiii/posters/Variability_and_predictability_of_geomag_activity_Hejda.pdf]
|
|
|