Global Warming Science: www.appinsys.com/GlobalWarming
Pacific Northwest Mountain Snowpack
[last update: 2010/06/06]
|
Pacific Northwest mountain snowpack is related to the El Nino / Southern Oscillation (ENSO) and Pacific Decadal Oscillation (PDO). This document examines the correspondence from 1995 – 2010.
[update: 2010/06/06 – Idaho section added] [original document: 2010/05/13]
|
|
El Nino / Southern Oscillation (ENSO)
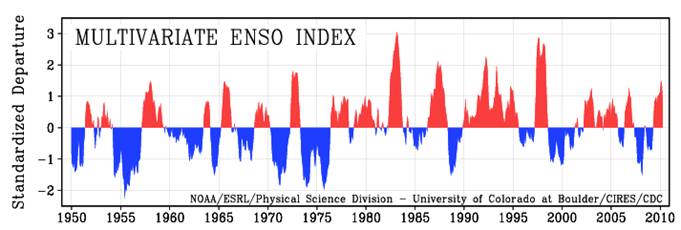
The NOAA Earth System Research Laboratory provides multivariate El Nino / Southern Oscillation (ENSO) Index (MEI) data [http://www.esrl.noaa.gov/psd/people/klaus.wolter/MEI/] The following figure shows the MEI from 1950 to 2010. (See: http://www.appinsys.com/GlobalWarming/ENSO.htm for more information on ENSO.)
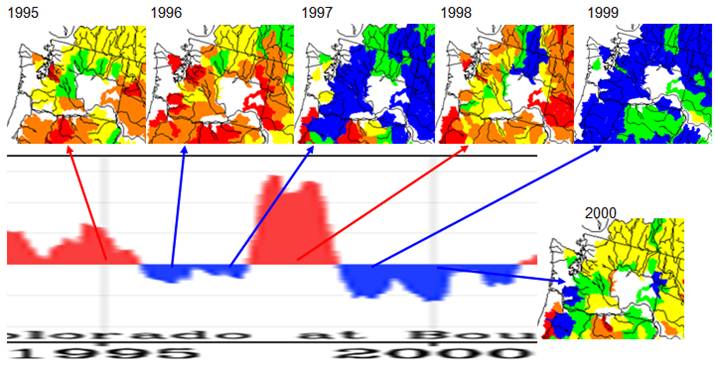
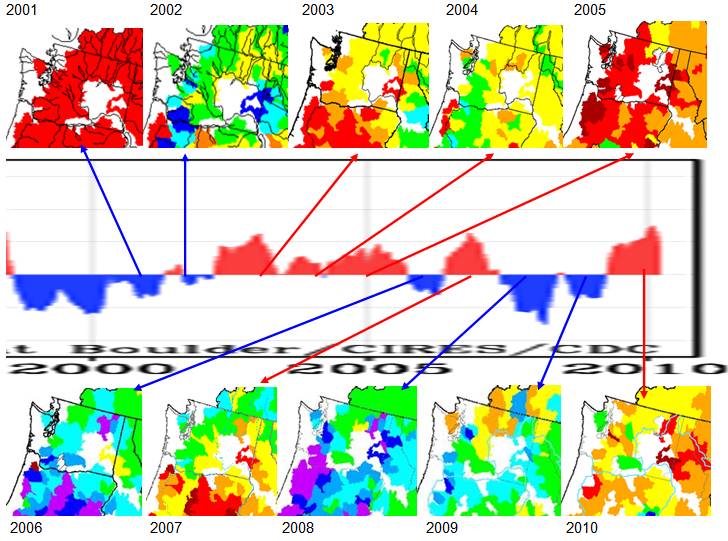
The Natural Resources Conservation Service provides mountain snowpack maps for the western US [http://www.wcc.nrcs.usda.gov/cgibin/westsnow.pl] The following figures compare the April 1 snowpack with the Multivariate ENSO Index. Arrows are colored to match sign of the MEI.
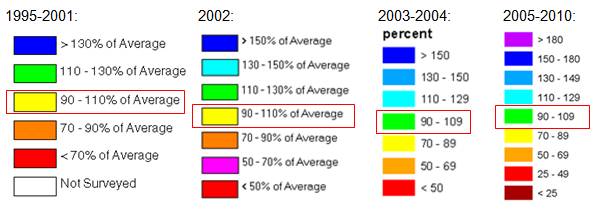
The following figure shows the legends for the above snowpack figures. Notes:
From the above snowpack figures, it can be seen that the April 1 snowpack corresponds to the ENSO (MEI). The only years when this is not the case are 1996 and 2001.
|
|
Pacific Decadal Oscillation (PDO)
The Pacific Decadal Oscillation (PDO) was identified in the mid-1990s and is calculated from sea surface temperatures and sea level pressures. (See http://www.appinsys.com/GlobalWarming/PDO.htm for more detailed information on the PDO.)
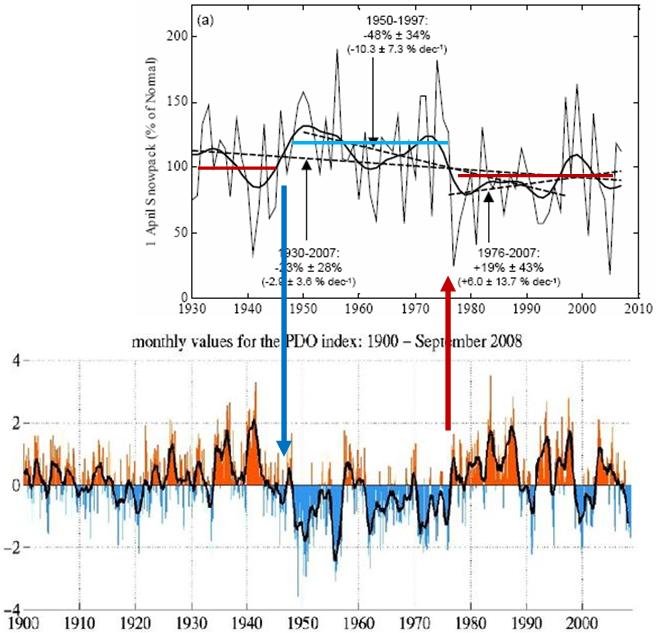
The following figure compares the Cascades mountain snowpack (from [ftp://ftp.atmos.washington.edu/stoeling/manuscripts/SWEpaper30Oct_rendered.pdf]) to the PDO (from [http://jisao.washington.edu/pdo/])
The changes in general snowpack levels correspond with the shifts in the PDO between negative and positive phases. The negative (cold) phase of the PDO corresponds to increased snowpack levels.
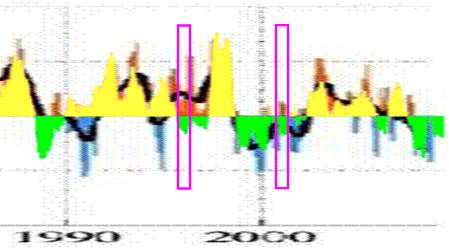
The next figure shows the ENSO-MEI (changed to yellow / green), superimposed on the PDO. The years 1996 and 2001 are indicated by the magenta boxes. In most years the MEI and PDO are in phase. In 1996 and 2001 they are out of phase – and the PDO is positive, resulting in reduced snowpack. This indicates that the PDO has a significant influence on the PNW mountain snowpack.
|
|
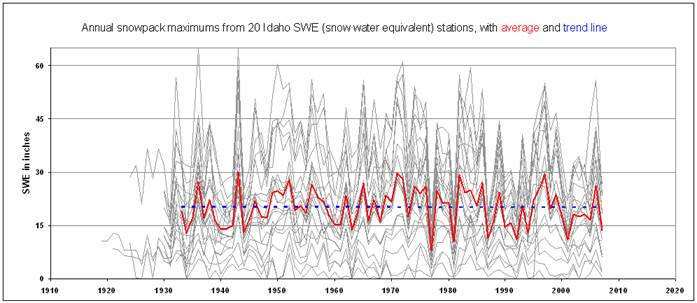
The following figure shows Idaho Snake River watershed snowpack for the 20 longest continuously measured snotel locations [http://westinstenv.org/sosf/2008/11/21/no-trend-in-idaho-snowpack-over-the-last-75-years/]
|
|
The False Alarm
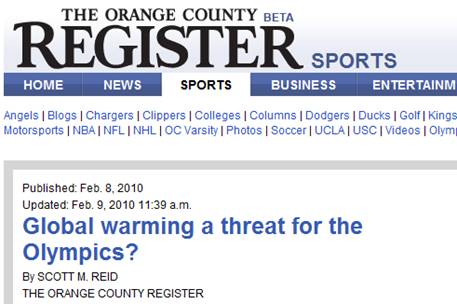
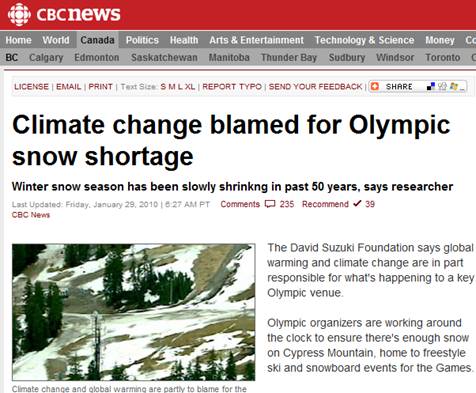
The coincidence of the 2010 winter Olympics with a winter El Nino was fodder for global warming alarmists.
[http://www.ocregister.com/sports/winter-233250-games-olympic.html]
From the above article: “One morning last week, environmentalist David Suzuki looked across English Bay from his Vancouver home to Cypress Mountain, usually covered in snow this time of year but now left all but bare by a warm winter. "I've watched in horror as the snow has just melted away from Cypress Mountain," Suzuki said, referring to the 2010 Olympic Games snowboarding and freestyle skiing venue. Global warming has placed the future of the Winter Olympics and winter sports from the Sierras to the Alps in peril, according to interviews with environmental scientists, Olympic officials, historians and athletes in recent weeks. As the 2010 Olympic Games open this week in Vancouver and Whistler, there is a growing concern within the Olympic and environmental movements that the Winter Games are in jeopardy of being significantly diminished if not eliminated all together by climate change.”
Of course Suzuki’s main mouthpiece – Canada’s CBC – also promotes his unsubstantiated claims.
[http://www.cbc.ca/canada/british-columbia/story/2010/01/28/bc-olympics-climate-change.html]
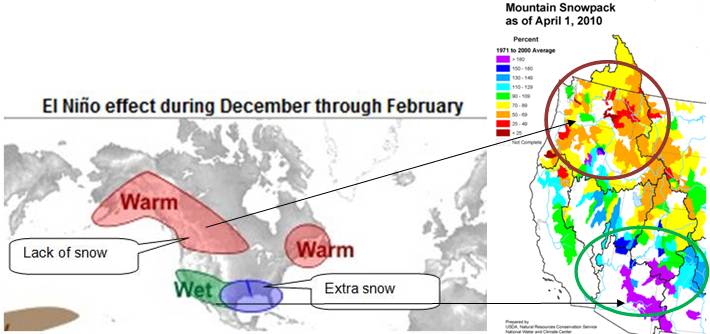
The following figures show (left) the typical winter El Nino impacts – warmer than normal in southern Canada, colder and snowier than normal in the southern US, and (right) the matching pattern on mountain snowpack.
[http://www.srh.weather.gov/srh/jetstream/tropics/enso_impacts.htm]
|
|
The Other False Alarm
Washington and Oregon Democratic politicians and environmentalists routinely blame reduced mountain snowpack on global warming.
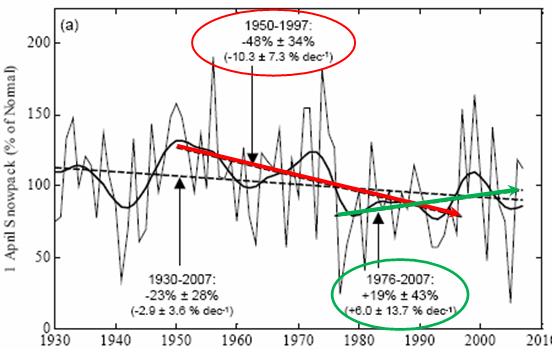
“April 1 snowpack in the Cascades declined about 50 percent from 1950 to 2000.” - Oregon Strategy for Greenhouse Gas Reductions, December 2004 “The average snowpack in the Cascades has declined 50 percent since 1950.” - Mayor Nickels’ letter to Seattle Times, Feb 2007
A selective choice of 1950 as a starting point in the statements leads to a misrepresentation of the facts. During the period assigned to CO2 influence – since the mid 1970s – the snowpack has shown an increasing trend. In actuality the trend goes up and down in sync with the PDO cycle as shown previously.
|
|
|