Global Warming Science - www.appinsys.com/GlobalWarming
Diurnal Temperature Range (DTR)
[last update: 2010/08/31]
|
The diurnal temperature range (DTR) is the difference between the daily maximum and minimum temperature. Changes in DTR have multiple possible causes (cloud cover, urban heat, land use change, aerosols, water vapor and greenhouse gases). Different regions are affected by different factors. Some researchers say decrease of DTR is evidence of “climate change”. Others say the decrease in DTR leveled off in the 1990s.
|
|
20th Century Trends in DTR
In 1997 Easterling et al (“Maximum and Minimum Temperature Trends for the Globe”, Science, Vol.227, July 1997 [http://www.met.sjsu.edu/~jin/METR112/paper/Scienceminmax.pdf]) reported: “Analysis of the global mean surface air temperature has shown that its increase is due, at least in part, to differential changes in daily maximum and minimum temperatures, resulting in a narrowing of the diurnal temperature range (DTR).”
“Analysis has shown that this rise [i.e. global mean surface air temperature] has resulted, in part, from the daily minimum temperature increasing at a faster rate or decreasing at a slower rate than the daily maximum, resulting in a decrease in the DTR for many parts of the world. Decreases in the DTR were first identified in the United States, where large-area trends show that maximum temperatures have remained constant or have increased only slightly, whereas minimum temperatures have increased at a faster rate.”
“Local effects such as urban growth, irrigation, desertification, and variations in local land use can all affect the DTR; in particular, urbanized areas often show a narrower DTR than nearby rural areas. Large-scale climatic effects on the DTR include increases in cloud cover, surface evaporative cooling from precipitation, greenhouse gases, and tropospheric aerosols. Recent studies have demonstrated a strong relation between trends of the DTR and decreases in pan evaporation over the former Soviet Union and the United States, suggesting that the DTR decrease in these areas is influenced by increases of cloud amount and reduced insolation.”
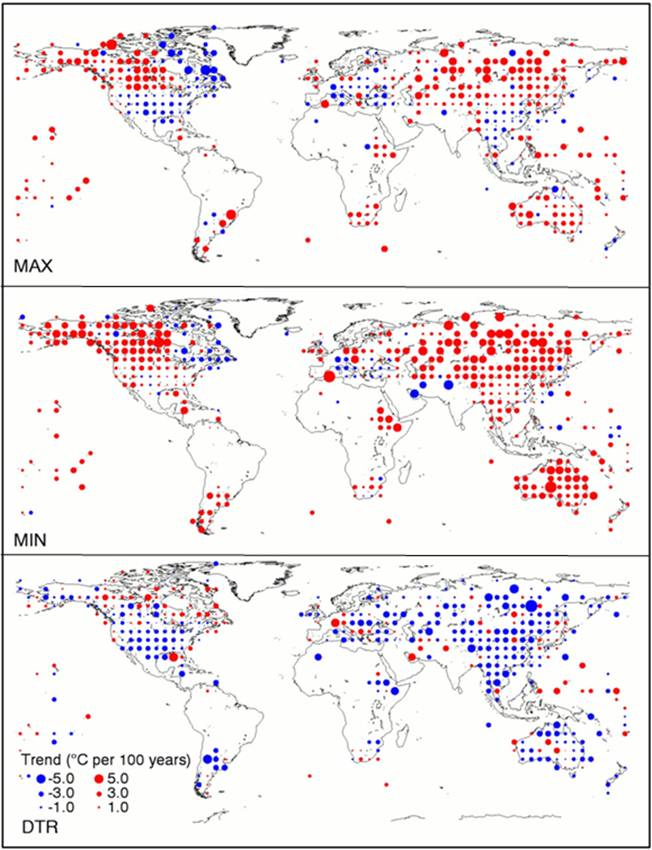
The following figure from the above paper shows “Trends (in degrees Celsius per 100 years) for each 5° by 5° latitude-longitude grid box using only nonurban stations for annual maximum temperature, annual minimum temperature, and diurnal temperature range” for the period 1950 to 1993.
Note that while more than half of the world’s temperature stations are in the US, there has generally been a reduction in the Max temperature there, as well as a reduction in DTR.
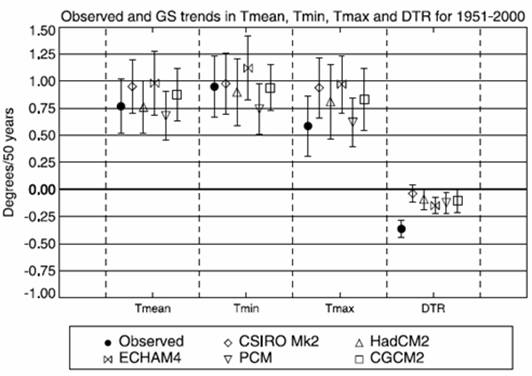
A 2004 study by Braganza et al attributes reduction in DTR to global warming (“Diurnal temperature range as an index of global climate change during the twentieth century”, Geophysical Research Letters, Vol.31, 2004 [http://www.met.sjsu.edu/~wittaya/journals/diurnalTempRange.pdf] : “Observed DTR over land shows a large negative trend of 0.4C over the last 50 years that is very unlikely to have occurred due to internal variability. This trend is due to larger increases in minimum temperatures (0.9C) than maximum temperatures (0.6C) over the same period. Analysis of trends in DTR over the last century from five coupled climate models shows that simulated trends in DTR due to anthropogenic forcing are much smaller than observed. This difference is attributable to larger than observed changes in maximum temperatures in four of the five models analysed here, a result consistent with previous modelling studies.” Braganza et al attribute the failure of the climate models to “poor representation of cloud changes over land” in the models. The study did not include effects of land use change. The following figure is from the Braganza et al study comparing the observed trend (black dot) with models.
Braganza et al state that “Diurnal temperature range appears to be a suitable index of climate variability and change”. This is contradicted by studies that actually consider land use change and urbanization as will be discussed later in this document.
|
|
Weekend Effect on DTR Due to Aerosols
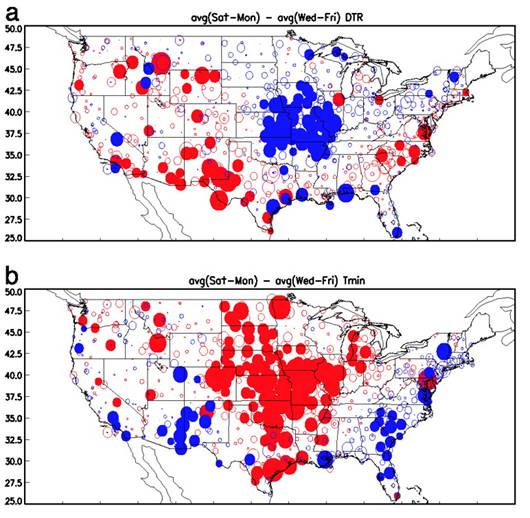
In 2003, Forster and Solomon (“Observations of a “weekend effect” in diurnal temperature range”, PNAS, [http://www.pnas.org/content/100/20/11225.full]) reported: “we find evidence of a weekly cycle in diurnal temperature range (DTR) for many stations in the United States, Mexico, Japan, and China. The “weekend effect,” which we define as the average DTR for Saturday through Monday minus the average DTR for Wednesday through Friday, can be as large as 0.5 K, similar to the magnitude of observed long-term trends in DTR. This weekend effect has a distinct large-scale pattern that has changed only slightly over time, but its sign is not the same in all locations. … we speculate that aerosol-cloud interactions are the most likely cause of this weekend effect”
The following figure from the above paper shows a) DTR difference (K) between the Saturday–Monday average DTR and the Wednesday–Friday average DTR and b) minimum temperature difference.
A weekend DTR effect has also been observed in the Tibetan Plateau area (You et al “Does a weekend effect in diurnal temperature range exist in the eastern and central Tibetan Plateau?”, [http://iopscience.iop.org/1748-9326/4/4/045202]) and is attributed to “the interaction with anthropogenic aerosols from local emissions and transported by atmospheric circulation may account for the weekly cycle in the Tibetan Plateau.” This paper also summarizes other observed aerosol weekly DTR effects: “In Germany, significant weekly periodicities are identified, and the interaction of a weekly aerosol cycles, supported by the existence of a significant weekly cycle in the aerosol optical thickness over the country and adjacent areas (Baumer et al 2008), and the dynamics of the atmosphere could possibly help to explain such phenomena”
Aerosols have a large influence on DTR. A 2008 study (Makowski et al “Diurnal temperature range over Europe between 1950 and 2005”, [http://www.atmos-chem-phys.org/8/6483/2008/acp-8-6483-2008.html]) states: “It has been widely accepted that diurnal temperature range (DTR) decreased on a global scale during the second half of the twentieth century. Here we show however, that the long-term trend of annual DTR has reversed from a decrease to an increase during the 1970s in Western Europe and during the 1980s in Eastern Europe. … 17 of the 24 investigated regions including the pan-European mean show a statistical significant increase of DTR since 1990 at the latest. … We find reasonable agreement between trends in SO2 emissions, radiation and DTR in areas affected by high pollution. Consequently, we conclude that the trends in DTR could be mostly determined by changes in emissions and the associated changes in incoming solar radiation.”
|
|
DTR and the Urban Heat Island Effect
The IPCC AR4 Physical Basis report [http://www.ipcc.ch/ipccreports/ar4-wg1.htm] makes the following statements:
Reduction in DTR is a well known phenomenon for urban environments.
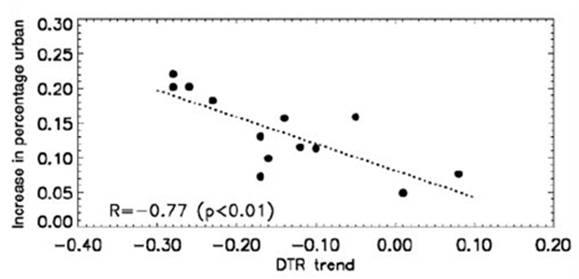
The following figure shows a relationship between the DTR trend and the increase in urbanization in China for 1979-1999 (From: Zhou et al “Evidence for a significant urbanization effect on climate in China” PNAS 2004 [http://www.ncbi.nlm.nih.gov/pmc/articles/PMC470710/pdf/1019540.pdf])
A 2007 study of the Beijing China urban heat island (UHI) effect compared Beijing with a nearby rural station (Liu et al “Temporal characteristics of the Beijing urban heat island”, Theoretical and Applied Climatology, Vol.87, 2007 [http://www.springerlink.com/content/d9h2l22577396t4p/]). It states: “UHI intensity for minimum temperature has a strong positive correlation with the increase in the urban population and the expansion of the yearly construction area. Seasonal analyses showed the UHI intensity is strongest in winter.”
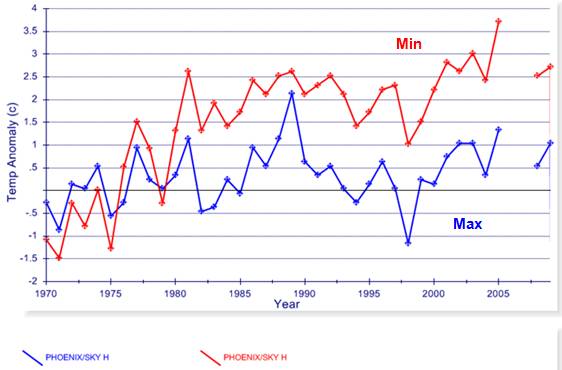
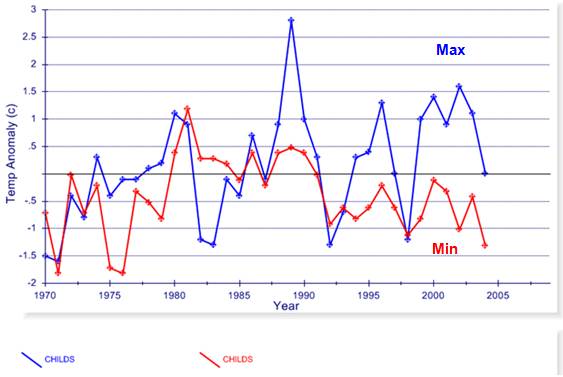
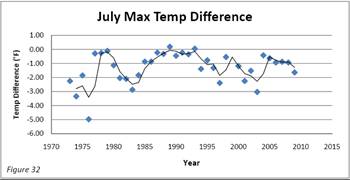
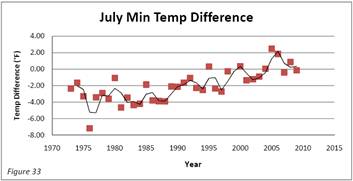
The following figures compare the minimum and maximum temperature anomalies for urban Phoenix and rural Childs Arizona. Data are from the NOAA GHCN database showing blue: maximum temperature anomaly, red: minimum temperature anomaly (plotted at http://www.appinsys.com/GlobalWarming/climate.aspx). Phoenix, which has had significant urban growth, exhibits the typical urban DTR trend. The rural Childs station shows the opposite trend – similar to the Chinese data shown above.
A 1996 study (Gallo et al, “The Influence of Land Use / Land Cover on Climatalogical Values of the Diurnal Temperature Range”, Journal of Climate, 1996 [http://digitalcommons.unl.edu/cgi/viewcontent.cgi?article=1193&context=natrespapers] found: “Those stations that were associated with predominantly rural land use / land cover (LULC) usually displayed the greatest observed DTR, whereas those associated with urban related land use or land cover displayed the least observed DTR. The results of this study suggest that significant differences in the climatological DTR were observed and could be attributed to the predominant LULC associated with the observation stations. The results also suggest that changes in the predominant LULC conditions, within as great as a 10 000 m radius of an observation station, could significantly influence the climatological DTR.”
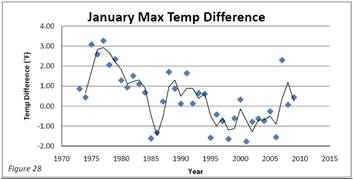
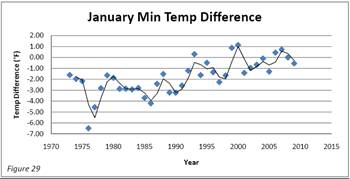
A 2010 study of Las Vegas UHI DTR (Alex Remar, “URBAN HEAT ISLAND EXPANSION IN THE GREATER LAS VEGAS METROPOLITAN AREA” [http://digitalcommons.calpoly.edu/cgi/viewcontent.cgi?article=1008&context=erscsp]) states: “Las Vegas’ urban minimum temperatures have been increasing at a substantial rate, while minimum temperatures in its rural surroundings have shown no statistically significant changes or trends. … these unnatural increases in minimum temperatures have reduced the diurnal temperature range of Las Vegas’ urban areas by 3°F more than its rural surroundings.”
The following figures from the above report show the temperature differences between the Las Vegas airport and the nearby Valley of Fire State Park
|
|
DTR and Clouds
The decrease in DTR since 1950 has been mainly attributed to increased cloud cover (often blamed on CO2 – increased CO2 causes warming causing increased water vapor and thus clouds, according to the theory, not the data).
Many studies contradict Braganza’s assertion (cited above in this document) that clouds are the missing piece. A 2007 study (Zhou et al, “Impact of vegetation removal and soil aridation on diurnal temperature range in a semiarid region: Application to the Sahel”, PNAS 2007 [http://www.ncbi.nlm.nih.gov/pmc/articles/PMC2084275/]) states: “Increased clouds and precipitation normally decrease the diurnal temperature range (DTR) and thus have commonly been offered as explanation for the trend of reduced DTR observed for many land areas over the last several decades. Observations show, however, that the DTR was reduced most in dry regions and especially in the West African Sahel during a period of unprecedented drought. Furthermore, the negative trend of DTR in the Sahel appears to have stopped and may have reversed after the rainfall began to recover. This study develops a hypothesis with climate model sensitivity studies showing that either a reduction in vegetation cover or a reduction in soil emissivity would reduce the DTR by increasing nighttime temperature through increased soil heating and reduced outgoing longwave radiation.”
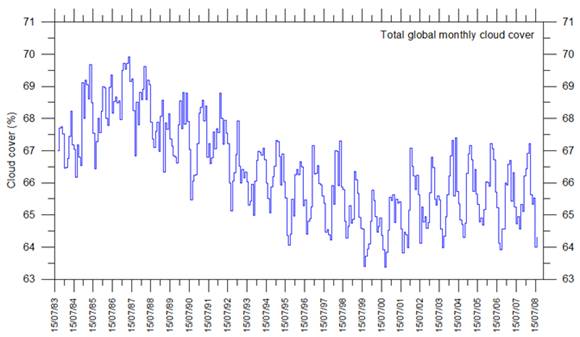
Satellite based cloud observations are only available starting in 1983. The following figure shows total global monthly cloud cover [http://climate4you.com/ClimateAndClouds.htm]
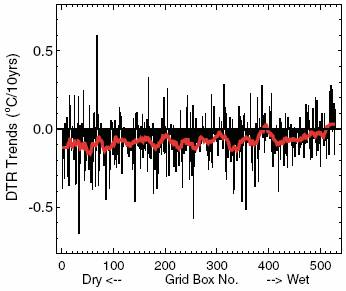
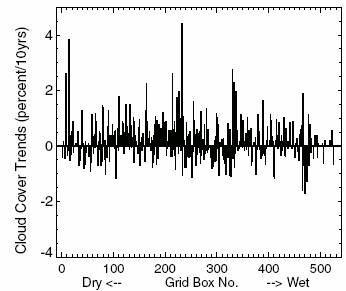
A study reported in 2008 (Zhou et al, “Spatial dependence of diurnal temperature range trends on precipitation from 1950 to 2004”, [http://climate.eas.gatech.edu/lzhou/2007CD-00165.pdf]) compared the DTR trends in 5x5 degree grid boxes with cloud cover and precipitation trends for 1950 to 2004. The following figures show the grid boxes sorted by precipitation (dry to wet - left to right), showing DTR trends (left) and cloud cover trends (right). The largest decreases in DTR have occurred in the dry areas. However, there is no corresponding trend in increasing cloudiness.
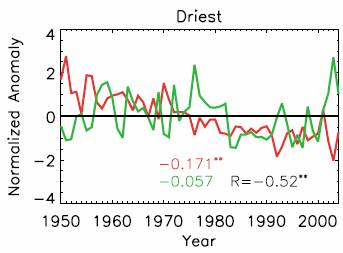
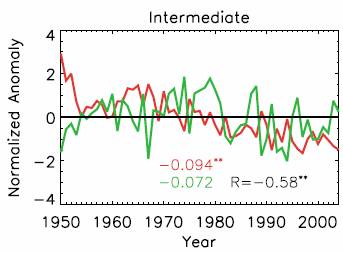
The same study showed the following figures for the grid boxes having a significant trend in DTR (referred to as case B in the study) for the driest and intermediate precipitation grid boxes showing DTR (red) and percent cloud cover (green).
The plot of the driest areas shows that while the DTR decreased through the entire period, the clouds increased from 1950 to 1975, then decreased until about 2000, then increased again. This shows the lack of data substantiating the claim that increased clouds are related to the decrease in DTR.
|
|
Conclusion
Although various factors can result in decreased DTR (urbanization, cloud cover, precipitation, greenhouse gases, aerosols, desertification), there is wide regional variation in the causes. This a problem with global studies of DTR – regional causes that differ do not offer information though wide-scale averaging. In China, increased aerosols are a main factor. In the United States (and most of the world) urban heat effects are the main drivers in DTR trends.
A 2007 study by Richard McNider (published in Geophysical Research Letters [http://pielkeclimatesci.wordpress.com/2007/07/02/in-the-dark-of-the-night-%E2%80%93-the-problem-with-the-diurnal-temperature-range-and-climate-change-by-richard-t-mcnider/]) states: “One of the most significant signals in the thermometer-observed temperature record since 1900 is the decrease in the diurnal temperature range over land, largely due to warming of the minimum temperatures. … The cause for this nighttime warming in the observed temperatures has been the subject of much debate. … Climate models have in general not replicated the change in diurnal temperature range well. While they do get a slight differential warming, it is generally less than 30% of that observed. … nighttime temperatures have risen almost twice as much as daytime temperatures over land since 1900 … if policymakers insist on constructing a global average near-surface air temperature trend as a diagnostic of greenhouse gas climate change, I encourage them to use only daily maximum surface temperatures.”
A lot of the AGW alarm is over more extreme hot weather, but “if models have replicated the mean temperature and yet underestimated the nighttime warming this means their maximum temperature trends have been larger than observed trends in maximum temperatures.” The DTR trends and the failure of the models indicate that fewer extreme hot weather events are actually to be expected due to increased CO2.
|
|
|