Global Warming Science - www.appinsys.com/GlobalWarming
Global Temperature From Satellites
[last update: 2011/01/16]
|
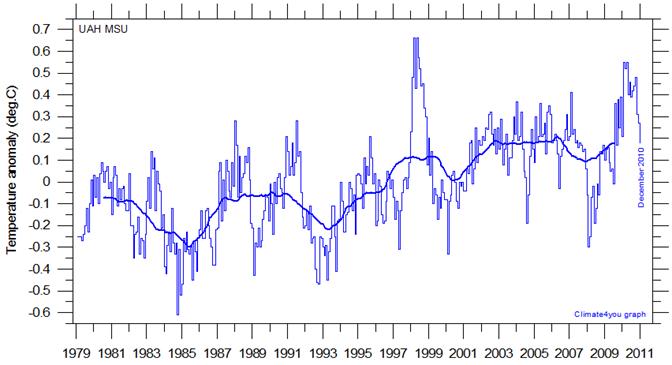
UAH Satellite Based Global Average Temperature Anomaly
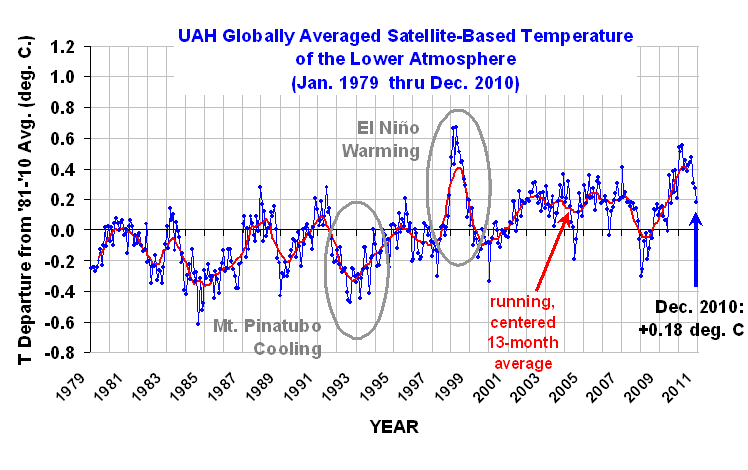
The UAH global temperature update is available for 2010 – average temperature anomaly for the year is 0.41 degrees (the warmest year, 1998 = 0.42 degrees – essentially the same). The monthly processed satellite data comes from Roy Spencer and is plotted in the figure below. [http://www.drroyspencer.com/2011/01/dec-2010-uah-global-temperature-update-0-18-deg-c/] The average of 0.41 comes from averaging the 12 months of 2010.
|
|
Temperatures From Satellites
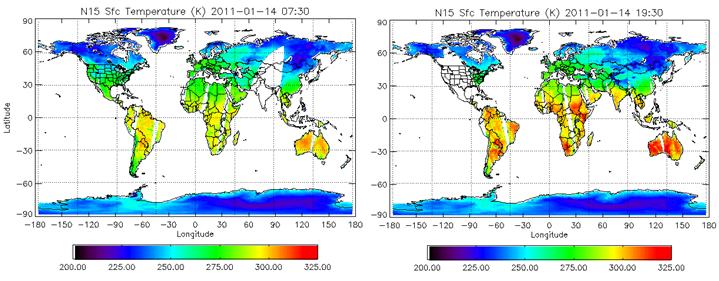
Roy Spencer (et al) provides a web site where temperatures can be plotted for various atmospheric altitudes [http://discover.itsc.uah.edu/amsutemps/]. They also explain what it represents: “Daily averaged temperatures of the Earth are measured by the AMSU [Advanced Sounding Microwave Unit] flying on the NOAA-15 satellite. The satellite passes over most points on the Earth twice per day. The AMSU measures the average temperature of the atmosphere in different layers from the surface up to about 135,000 feet or 41 kilometers.” The AMSU provides brightness measurements that are converted to temperatures using the inverse of the Planck function (see the web site for details).
Satellite based temperature data were started in 1979 (actually December 1978). The UAH temperature data are available here: http://vortex.nsstc.uah.edu/data/msu/t2lt/uahncdc.lt The NOAA data products are available here: http://www.osdpd.noaa.gov/ml/mspps/index.html
The following figures show the (closest to) land surface temperatures from the two satellite passes on January 14, 2011 from the NOAA 15 AMSU-A (from the above NOAA website).
Roy Spencer explains how the satellite microwave radiometers work here: “How the UAH Global Temperatures Are Produced” [http://www.drroyspencer.com/2010/01/how-the-uah-global-temperatures-are-produced/] In December 2010, UAH switched to using a 30-year base period (1981-2010) for the calculation of anomalies, since there are now 31 complete years of data available since the start of the satellite data.
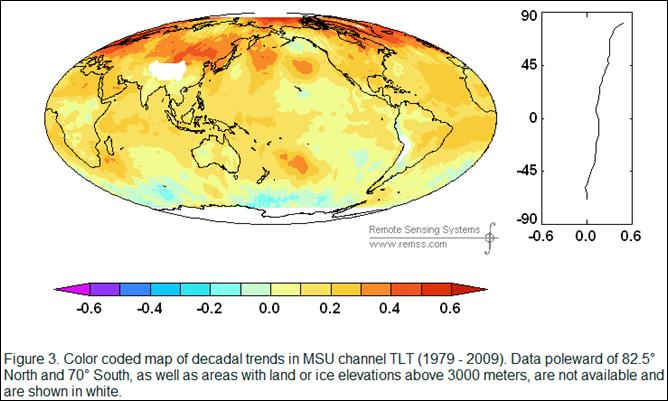
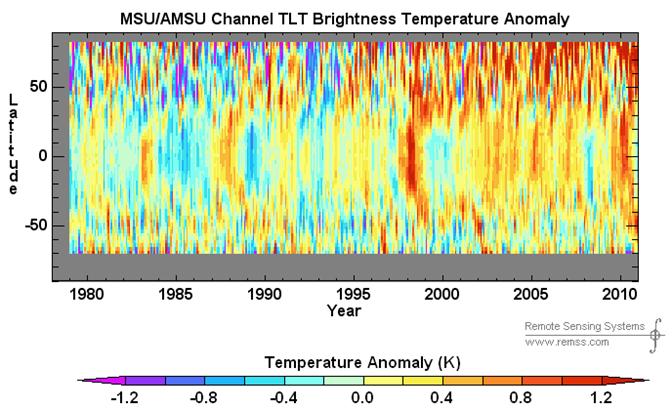
Remote Sensing Systems (RSS) provides a slightly different processing of the satellite data from UAH and provides information and data plotting at http://www.remss.com/msu/msu_data_description.html The following figure from that web site shows the temperature trend for 1979 – 2009 from the RSS data. (Since there is a distinct latitudinal variation in the trend, alarmists changed the term “global warming” to “climate change” since the warming isn’t global – see: http://www.appinsys.com/GlobalWarming/GW_NotGlobal.htm)
The TLT channel represents the satellite measurements closest to the Earth’s surface.
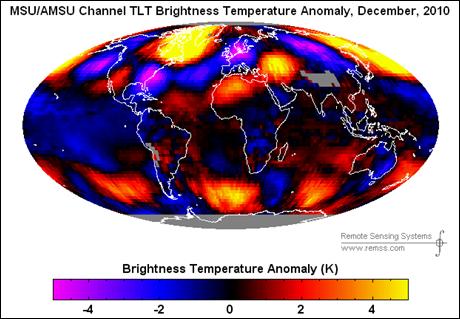
The RSS site provides monthly temperature anomaly plots for any month / year in the satellite data (i.e. since December 1979) http://www.remss.com/msu/msu_data_monthly.html The following example shows December 2010.
The RSS site also provides updated global temperature anomaly by latitude and time as shown in the following figure. The El Nino’s of 1987, 1998 and 2010 are clearly visible, as is the Arctic warming trend.
Monthly average sea surface temperatures since 2002 from NASA’s Aqua Satellite are available on the NASA Earth Observatory web site [http://earthobservatory.nasa.gov/GlobalMaps/view.php?d1=MYD28M#]
Monthly average sea surface temperatures since 2000 from NASA’s Terra Satellite are available on the NASA Earth Observatory web site [http://earthobservatory.nasa.gov/GlobalMaps/view.php?d1=MOD11C1_M_LSTDA]
|
|
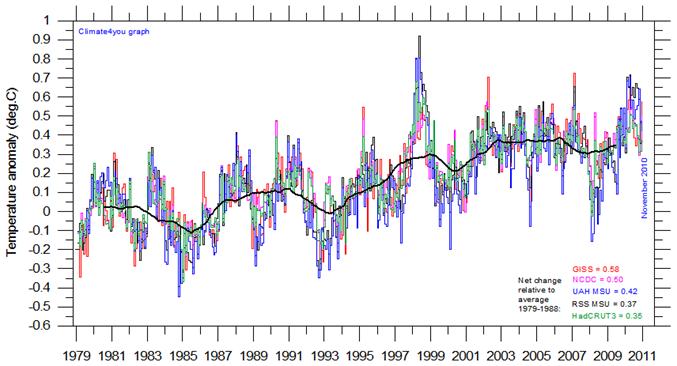
Global Temperature Data Set Comparison
The Climate4you web site [http://climate4you.com/] provides updated plots of the UAH data, as well as other global temperature sets, and provides comparisons between them. The plots below are from this web site.
UAH global temperature:
Comparison of UAH and RSS (from satellite data), HadCRUT3, GISS and NCDC (from land / sea based data):
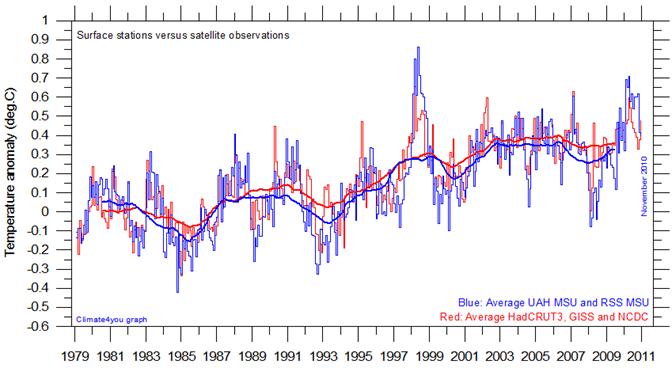
Comparison of UAH and RSS averaged (blue) with HadCRUT3, GISS and NCDC averaged (red):
|
|
Satellite Corrections
Similar to the surface based measurements (which are adjusted upwards to increase the warming trend – see: http://www.appinsys.com/GlobalWarming/GW_Part2_GlobalTempMeasure.htm), the satellite derived temperatures are adjusted.
The RSS scientists Mears and Wentz (“The Effect of Diurnal Correction on Satellite-Derived Lower Tropospheric Temperature”, Science, September 2005) made the following statements
In other words, if observations don’t match the theoretical models, adjust the data.
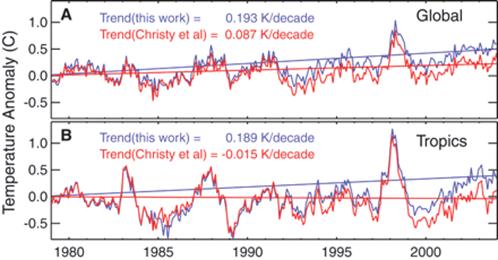
The following figure is from the above paper showing the effects of their upwards adjustment (blue).
In the above figure, the red line refers to Christy et al. Christy et al acknowledge the need for diurnal adjustments [http://www.ncdc.noaa.gov/temp-and-precip/msu/uah-msu.pdf]: “Some studies, motivated by the lack of agreement between trends of surface records and those of the MSU troposphere, offered several suggestions for the differences, which we have addressed elsewhere (Spencer et al. 1996; Christy et al. 1997, 1998). More recently, the discovery by Wentz and Schabel of one significant and necessary adjustment due to satellite orbit decay, the finding of Mo (1995) regarding NESDIS calibration errors, and our discoveries related to diurnal effects and instrument heating all lead to the present effort.”
Christy et al state “we are able to state that the decadal trend for 1979–98 for T2 · D (T2LT · D) is +0.04 (+0.06) K per decade +/- 0.06, but that these quantities have little predictive value because of the shortness of the time series. (In particular, the error range here is limited strictly to measurement error only and does not include uncertainties due to sampling of a relatively short time series.)”
|
|
|