Global Warming Science - www.appinsys.com/GlobalWarming
Minnesota, USA
[last update: 2010/04/02]
|
Temperature
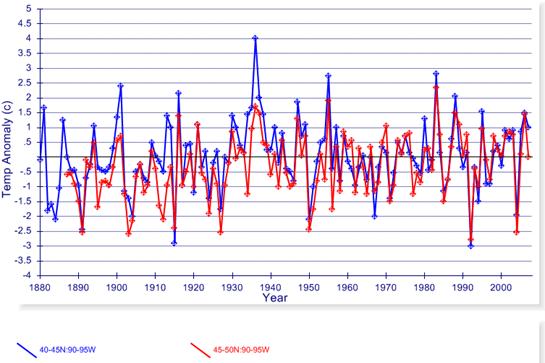
The following figure shows average annual mean temperatures from the NOAA GHCN database for the available long-term rural stations in Minnesota. Some stations show some recent warming, but only because of the cool 1970s and it is still not warmer than the 1930s.
|
|
Precipitation
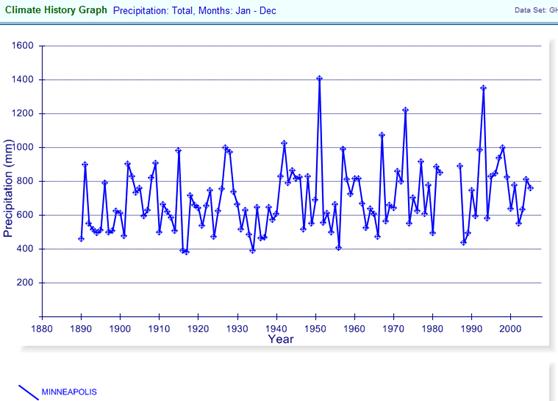
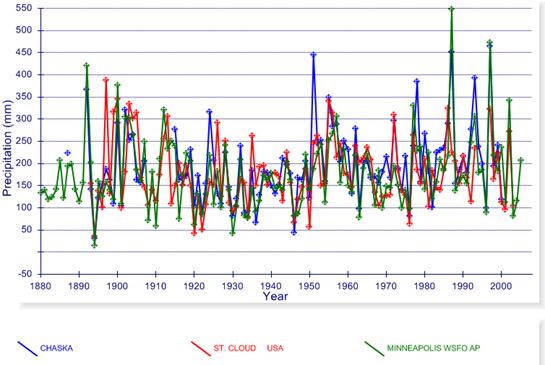
The following figure shows the historical total annual precipitation for Minneapolis from the GCHN data (plotted at http://www.appinsys.com/GlobalWarming/climate.aspx).
(Minneapolis climate details are available at: http://home.att.net/~minn_climo/)
|
|
Model Projections Contradicted by Data
The alarmists at Climate Central (slogan: “Sound science & vibrant media”) have an interactive map showing the area projected to be above freezing in the coming decades. They say “US temperatures have been warming over the last century, and climate scientists expect much more of the same in the future. In the American West, spring temperatures have especially come up. Besides sounding rather cheerful, warmer springs mean snow melting sooner.”
If only their science was as sound as their media are vibrant.
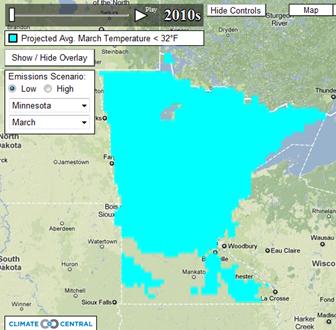
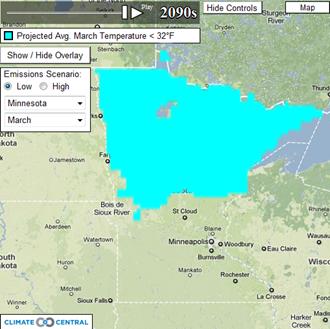
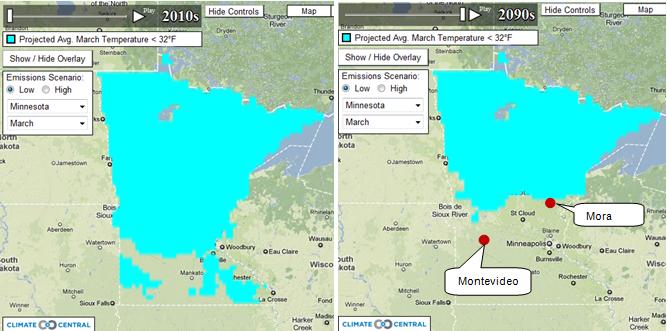
The images below show their area of Minnesota with average March temperature below freezing for 2010s and 2090s under a “low emissions” scenario.
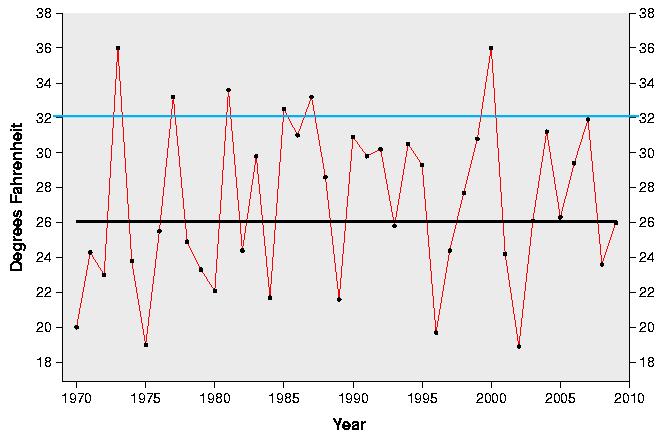
The following figure shows average March temperature for Minnesota from 1970 to 2009 (from http://www.ncdc.noaa.gov/oa/climate/research/cag3/state.html) The blue line is 32 F – freezing. Minnesota has had only one March above freezing since the mid 1980s and a declining trend since the mid-1970s.
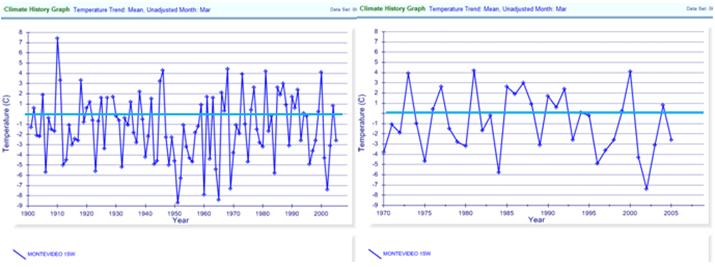
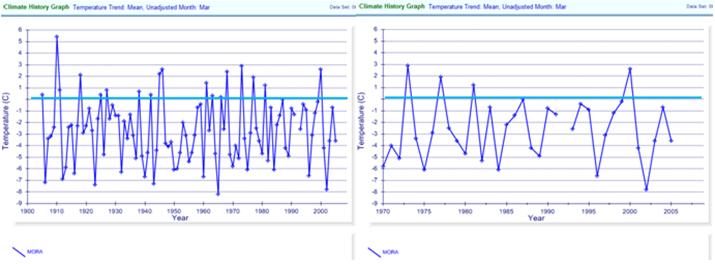
The following figures show average March temperatures for two stations in Minnesota: Montevideo (top) and Mora (bottom), (locations indicated on the map below), with data since 1900 (left) and since 1970 (right). (NOAA GHCN data plotted at: http://www.appinsys.com/GlobalWarming/climate.aspx) These two locations are projected to move from the March freezing area to the March melt area according to climate central. But the data show a declining March temperature. Data since 1970 are significant since according to the IPCC the CO2 influence becomes evident after 1970. (The blue line at 0 C is the line of freezing temperatures.)
Alarmists don’t let data get in the way of their “projections”. Unsound science but vibrant media.
|
|
Minnesota’s Bridge Collapse
The global warming alarmist sites consider everything to be hot. For example, the alarmist “Climate Progress” site [http://climateprogress.org/2007/08/06/did-climate-change-contribute-to-the-minneapolis-bridge-collapse/#more-1120] attempts to blame the 2007 Interstate 35 W bridge collapse on global warming: “The question remains, do we need to climate-proof our bridges, does a connection exist between climate change and the collapse of the I-35W bridge?”
The bridge collapsed on August 1, 2007. The following figure shows the average July and August temperatures from 1880 to 2007 from the HadCRUT data (used by the IPCC) for the two 5-degree grids (since Minneapolis is at 45 N). If the day of the collapse was hot, it was obviously not due to global warming since July / August temperatures show no significant warming.
Built in 1967, the bridge apparently suffered from some longer-term fatigue. The 2001 bridge inspection report [http://www.lrrb.org/pdf/200110.pdf] stated: “The approach spans have exhibited several fatigue problems; primarily due to unanticipated out-of-plane distortion of the girders. Although fatigue cracking has not occurred in the deck truss, it has many poor fatigue details on the main truss and floor truss systems. Concern about fatigue cracking in the deck truss is heightened by a lack of redundancy in the main truss system.” Collapse caused by global warming? It’s hard to come up with the appropriate adjective for the global warming alarmists.
The following figure shows the July + August precipitation for three Minneapolis area stations from the NOAA GHCN database. Recent years have been normal.
|
|
Minnesota’s Moose Decline
A typical alarmist piece – this time The Los Angeles Times “Moose are roaming right out of existence” (Dec. 29, 2008)
See http://www.appinsys.com/GlobalWarming/Minnesota_MooseDecline.htm for the details debunking this scare story.
|