Global Warming is Killing Minnesota’s Moose
Of course global warming is killing everything these days, but today it’s the moose.
A typical alarmist piece – this time The Los Angeles Times “Moose are roaming right out of existence” (Dec. 29, 2008)
[http://www.latimes.com/news/science/environment/la-na-minnesota-moose29-2008dec29,0,3445902.story]
It focuses on Minnesota’s moose population – statements from the article:
· “the number of antlered, bony-kneed beasts from the North Woods has plummeted from 4,000 to fewer than a hundred … the primary culprit, scientists say, is climate change, which has systematically reduced the Midwest's already dwindling moose population and provoked alarm in Minnesota
· “Over the last 40 years in northwest Minnesota, the average winter temperature has risen significantly -- 12 degrees -- and summers are 4 degrees warmer
· “There are about 7,700 moose in Minnesota, nearly all in the northeast part of the state. That's down about 50% from 20 years ago.
· “Isle Royale National Park, a 45-mile-long island in western Lake Superior, has about 650 moose, down from 2,500 in 1995. Michigan's sparsely populated Upper Peninsula has about 450, and that population has remained steady
· “a decadelong trend of hotter-than-normal summers, according to a report issued in March, has negatively affected moose … "I don't see the temperature change we're seeing as cyclical. The trend is definitely in one direction," Peterson said
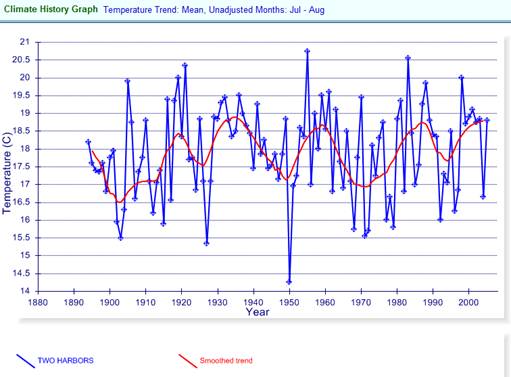
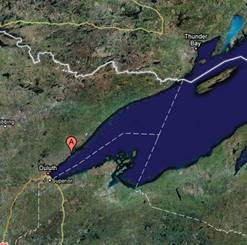
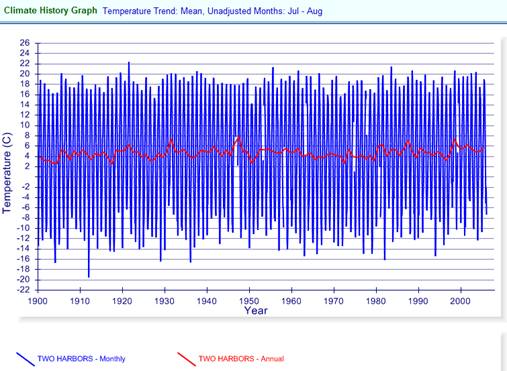
The following graph shows July – August average temperature for Two Harbors, MN the closest long-term station in the NOAA Global Historical Climate Network (location indicated on the adjacent map). The blue line in the graph shows the average July – August temperature for each year since 1891, the red line shows the smoothed trend. Notice the following:
- “Over the last 40 years in northwest Minnesota… summers are 4 degrees warmer” – This is actually almost true – by selecting the late 1960s as the starting point to the late 2000s (40 years), summer temperatures have increased about 3 degrees C. This is called “cherry-picking” data – i.e. ignoring most of the data and carefully selecting a starting point.
- “a decadelong trend of hotter-than-normal summers … I don't see the temperature change we're seeing as cyclical. The trend is definitely in one direction” – This is just not very credible (except by ignoring most of the data).
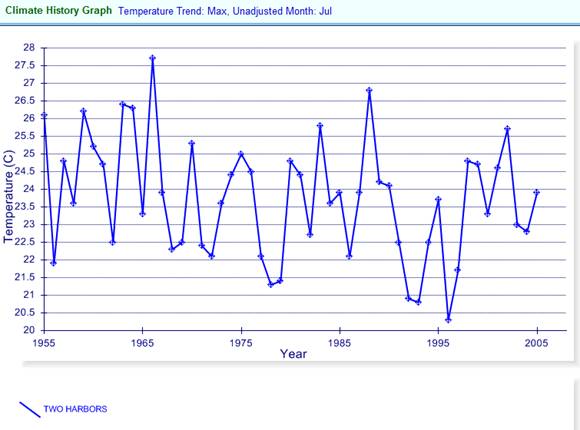
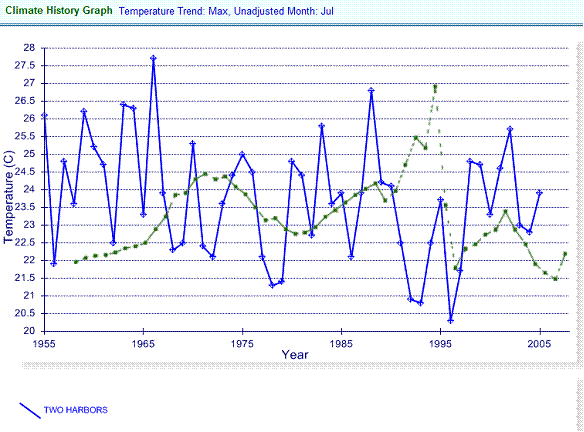
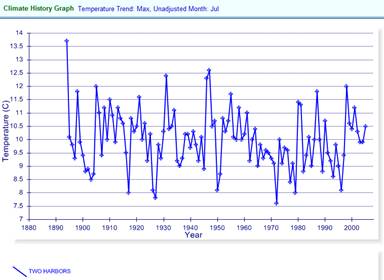
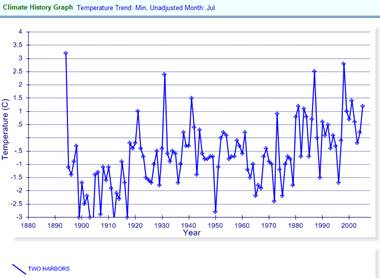
The following graphs show July maximum temperature – i.e. daytime (left) and minimum temperature – i.e. nighttime (right). The daytime maximum temperatures are within the long-term norm. The nighttime minimum temperatures have been increasing long-term so that they are recently just slightly above freezing. This warming trend began in the 1800s, and since the IPCC says CO2 has only affected warming in the last three decades, this warming trend is obviously not man-made.
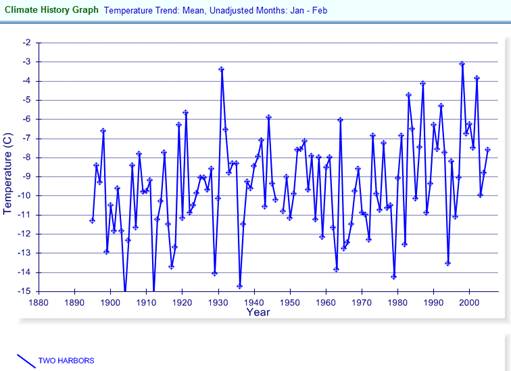
The following figure shows January – February average temperatures for Two Harbors. “Over the last 40 years in northwest Minnesota, the average winter temperature has risen significantly -- 12 degrees” – This is once again almost true (although 12 degrees is clearly an exaggeration) by cherry-picking the start date (and ignoring that since 1998 temperatures have been generally declining and have recently been in the “normal” range). Winter temperatures have increased more than summer temperatures long-term, but given that they say “hotter-than-normal summers … has negatively affected moose” warmer winters (still below freezing) are probably not a problem for moose. In fact later in this document we will see that cold winters are harder on the moose.
The following figure shows average temperatures for Two Harbors – monthly data shown in blue and annual average shown in red. July is the warmest month and appears at the top of each blue cycle in the graph. January is the coldest month and appears at the bottom of each blue cycle. This shows the range of temperatures that the moose exist in.
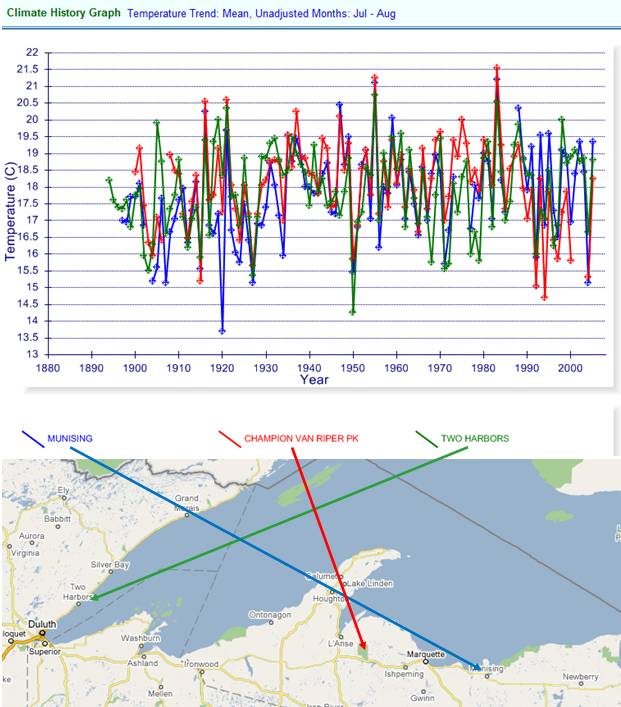
The following graph compares July – August temperatures for Two Harbors, along with two locations on Michigan’s Upper Peninsula. The temperatures are very similar for all three locations. The LAT article stated: “Michigan's sparsely populated Upper Peninsula has about 450, and that population has remained steady“. So why has the UP population remained steady while the MN population has declined, when the temperatures are so similar at these locations? Global warming?
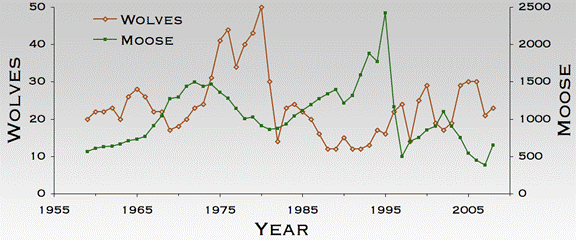
The LA Times article stated: “Isle Royale National Park, a 45-mile-long island in western Lake Superior, has about 650 moose, down from 2,500 in 1995”. This population of moose is trapped on the island. Previous reports from other sources provide other insights:
“Moose population keeps dropping on Isle Royale” [http://www.detnews.com/2005/metro/0503/17/B07-119600.htm]: “Mercilessly hounded by blood-sucking ticks, the Isle Royale moose herd is on a downward spiral -- and the wolf packs that roam the national park in Lake Superior are taking advantage … The moose population fell to about 540 this winter [2005], down from 740 last year and 1,100 during the winter of 2002-03 … shortage of balsam fir, their primary food source in winter … Meanwhile, wolf numbers jumped from 19 to 29 last season and reached 30 this year”
“Ticks Reduce Isle Royale Moose Population” [http://www.admin.mtu.edu/urel/news/media_relations/82/]: “the 2003 survey counted 19 wolves on the island, as opposed to 17 last year. The island's moose population decreased from about 1,100 last year to 900 in 2003. … Weather continues to play a role in another way. Isle Royale “had as long a stretch of cold as I’ve ever seen,” Peterson said. “Many moose died in 1996,” he said”
“In Long-Running Wolf-Moose Drama, Wolves Recover From Disaster” [http://www.admin.mtu.edu/urel/PressReleases/feature/wolves/wolf.html]: “By the winter of 1994-95, the Isle Royale moose population stood at 2,400, the biggest herd since the early 1930’s and far higher than any count since 1949”
Recent articles often blame the moose decline on increased ticks due to global warming. For example, “Wolves, ticks thin Isle Royale Herds” [http://www.jsonline.com/features/29256589.html]: “global warming - by giving an assist to blood-sucking bugs - ultimately could deal a deathblow to the national park's wolf population. … as many as 100,000 ticks can infest a single moose. Sometimes, the ticks take so much blood the moose dies. When spring and fall temperatures are warmer, more ticks can breed.”
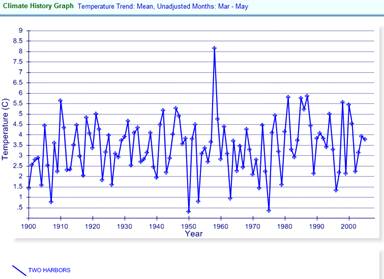
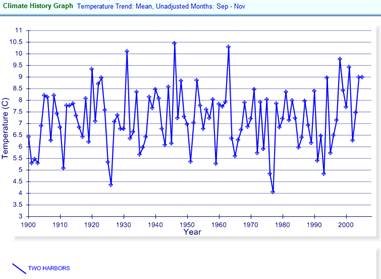
The following graphs show the average spring (left) and fall temperatures (right) for Two Harbors. Perhaps these types of articles are not being so honest.
The following figure shows the moose population on Isle Royale since 1958 (green line) [www.isleroyalewolf.org/essays/essays/chronology_files/museum%20history%20of%20wolves%20handout.doc]: “In 2008, 23 wolves and about 650 moose inhabited Isle Royale - close to levels first observed 50 years ago. … In 1980, wolves were abundant and moose had been on the decline for the better part of a decade. The next two years were dramatic. Wolves plummeted from 50 to 14. Canine parvovirus, a disease brought to Isle Royale by a domestic dog, was largely to blame for the decline. While predation was low during the late 1980s and