Global Warming Science - www.appinsys.com/GlobalWarming
Climate Data Sets Updated to Include 2010 Data on the AIS Climate Data Visualizer
[last update: 2011/03/12]
|
The AIS Climate Data Visualizer (www.appinsys.com/GlobalWarming/Climate.aspx) has been updated with data through 2010 for the NOAA GHCN temperature and precipitation data sets and the Hadley / CRU gridded land temperature data (CRUTEM3) and sea surface temperature data (HadSST2).
These data have been updated from:
For more details on these data sets see: www.appinsys.com/GlobalWarming/ClimateData.htm
When graphing the average of multiple stations: if the number of stations / grids is > 80 a line length limit for the URL may be encountered in Internet Explorer. Chrome and Safari do not have this problem. The grid / selection controls work better in Internet Explorer. (Part of the problem with trying to do useful web application programming – none of the browsers handle everything correctly.)
|
|
The Arctic
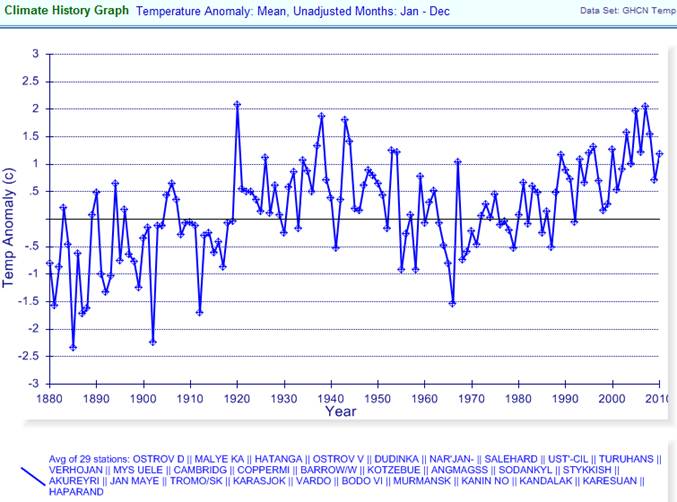
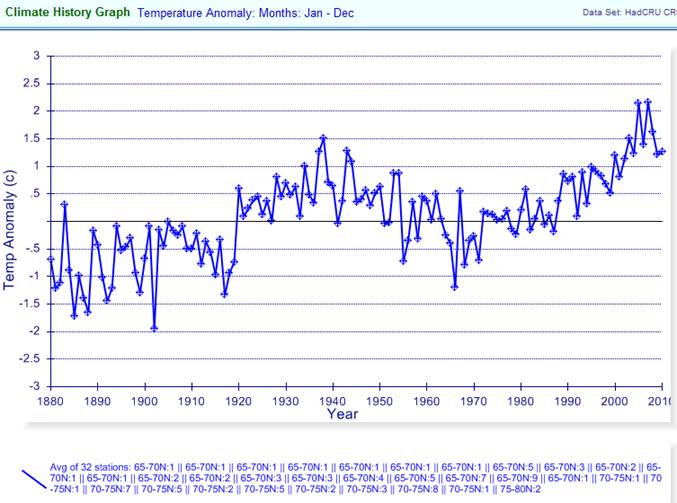
The following figures compare the annual average temperature anomaly data for the Arctic for NOAA GHCN (unadjusted) and Hadley CRUTEM3 (adjusted and averaged over 5x5 degree grids). All stations or grids north of 65N with data extending from before 1930 to after 2000 have been included.
GHCN – 29 stations
CRUTEM3 – 32 5x5 grids
The average annual temperature anomaly for the Arctic for 2010 was similar to 2009. Both years have reduced temperatures since the mid-2000s highs.
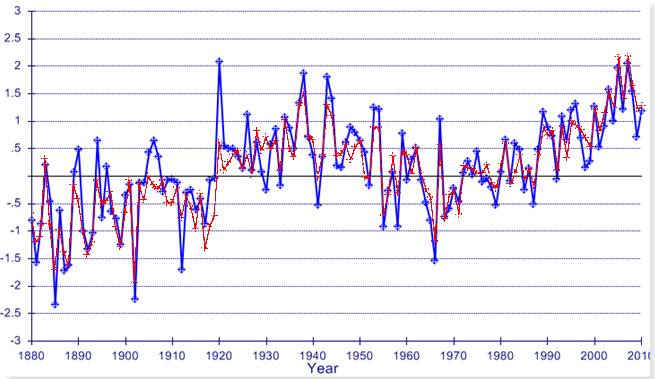
The following figure compares the above two figures with GHCN in blue and CRUTEM3 in red. Hadley/CRU adjustments result in reduction in past warm years in the 1920s-1940s and slightly warmer temperatures in the mid-2000s.
|
|
|