Global Warming Science - www.appinsys.com/GlobalWarming
Minnesota – Historical March Data Contradict Alarmist Projections
[last update: 2010/04/02]
|
The alarmists at Climate Central (slogan: “Sound science & vibrant media”) have an interactive map showing the area projected to be above freezing in the coming decades. They say “US temperatures have been warming over the last century, and climate scientists expect much more of the same in the future. In the American West, spring temperatures have especially come up. Besides sounding rather cheerful, warmer springs mean snow melting sooner.”
If only their science was as sound as their media are vibrant.
|
|
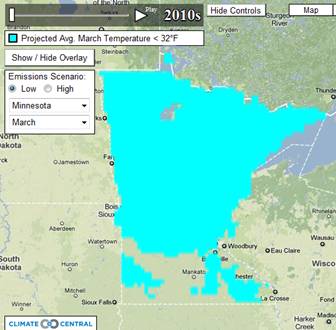
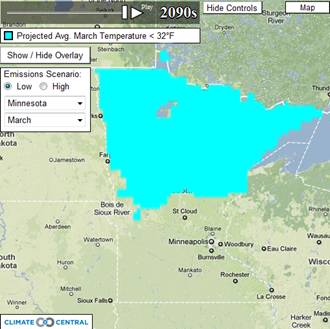
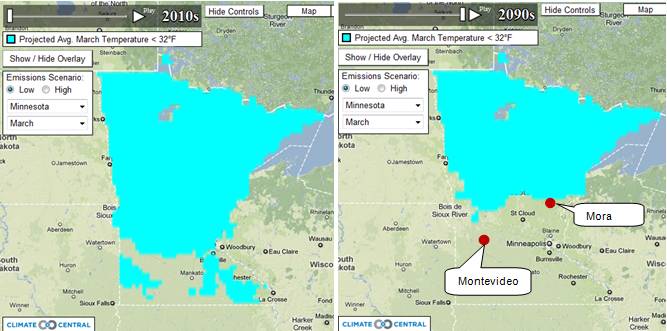
The images below show their area of Minnesota with average March temperature below freezing for 2010s and 2090s under a “low emissions” scenario.
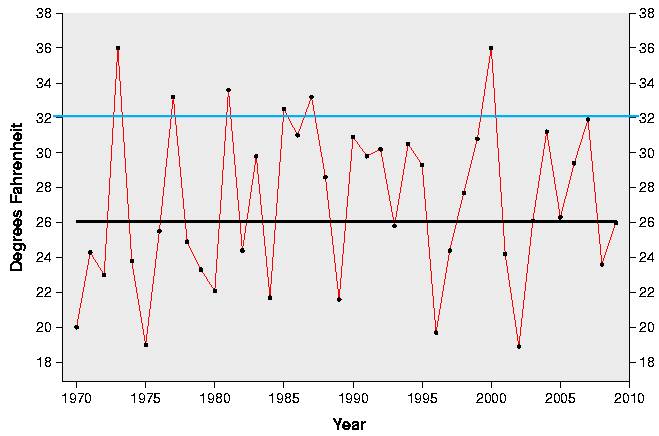
The following figure shows average March temperature for Minnesota from 1970 to 2009 (from http://www.ncdc.noaa.gov/oa/climate/research/cag3/state.html) The blue line is 32 F – freezing. Minnesota has had only one March above freezing since the mid 1980s and a declining trend since the mid-1970s.
|
|
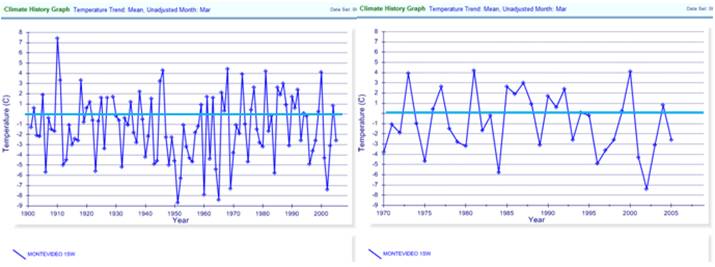
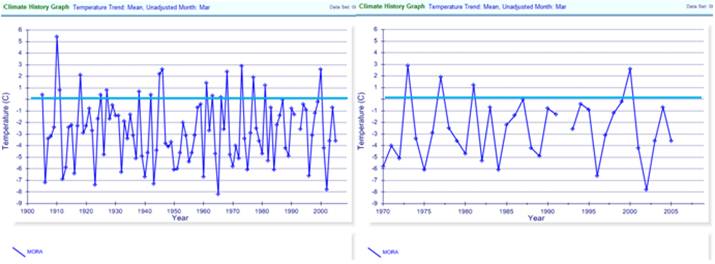
The following figures show average March temperatures for two stations in Minnesota: Montevideo (top) and Mora (bottom), (locations indicated on the map below), with data since 1900 (left) and since 1970 (right). (NOAA GHCN data plotted at: http://www.appinsys.com/GlobalWarming/climate.aspx) These two locations are projected to move from the March freezing area to the March melt area according to climate central. But the data show a declining March temperature. Data since 1970 are significant since according to the IPCC the CO2 influence becomes evident after 1970. (The blue line at 0 C is the line of freezing temperatures.)
Alarmists don’t let data get in the way of their “projections”. Unsound science but vibrant media.
|
|
For more information on Minnesota’s climate and alarms, See: http://www.appinsys.com/GlobalWarming/RS_MinnesotaUSA.htm
|
|
|