Global Warming Science - www.appinsys.com/GlobalWarming
IPCC AR5 Leak – Report Admits No Warming, Predicts Extreme Sea Level Rise
[last update: 2012/12/22]
|
Dec 13, 2012: Alec Rawls Leaked the draft of the IPCC AR5 report: http://www.stopgreensuicide.com/
From the above link: “I [Alec Rawls] participated in "expert review" of the Second Order Draft of AR5 (the next IPCC report), Working Group 1 ("The Scientific Basis"), and am now making the full draft available to the public. I believe that the leaking of this draft is entirely legal, that the taxpayer funded report is properly in the public domain under the Freedom of Information Act, and that making it available to the public is in any case protected by established legal and ethical standards, but web hosting companies are not in the business of making such determinations so interested readers are encouraged to please download copies of the report for further dissemination in case this content is removed as a possible terms-of-service violation.”
The PDF’s of each chapter are available at http://www.stopgreensuicide.com/
The IPCC creates a new assessment report every 5 or 6 years: First Assessment Report (FAR): 1990 Second Assessment Report (SAR): 1995 Third Assessment Report (TAR): 2001 Fourth Assessment Report (AR4): 2007 Upcoming Fifth Assessment Report (AR5): due 2013, leaked Dec. 2012
|
||||||||||
|
Global Temperature Change Projections – Fail
The following figure is from Chapter 1 of the AR5 report. The colored bands represent the temperature projections from each of the previous Assessment Reports, while the black dots indicate the observed temperatures. The observed temperatures are near or below the low end projections. According to the models this would only occur only if CO2 emissions had been reduced over the last decade – but they have continued to rise.
(The AR5 figure explanation states: “Estimated changes in the observed globally and annually averaged surface temperature (in C) since 1990 compared with the range of projections from the previous IPCC assessments. Values are aligned to match the average observed value at 1990. Observed global annual temperature change, relative to 1961–1990, is shown as black squares (NASA (updated from Hansen et al., 2010; data available at http://data.giss.nasa.gov/gistemp/); NOAA (updated from Smith et al., 2008; data available at http://www.ncdc.noaa.gov/cmb-faq/anomalies.html#grid); and the UK Hadley Centre (Morice et al., 2012; data available at http://www.metoffice.gov.uk/hadobs/hadcrut4/) reanalyses). Whiskers indicate the 90% uncertainty range of the Morice et al. (2012) dataset from measurement and sampling, bias and coverage”)
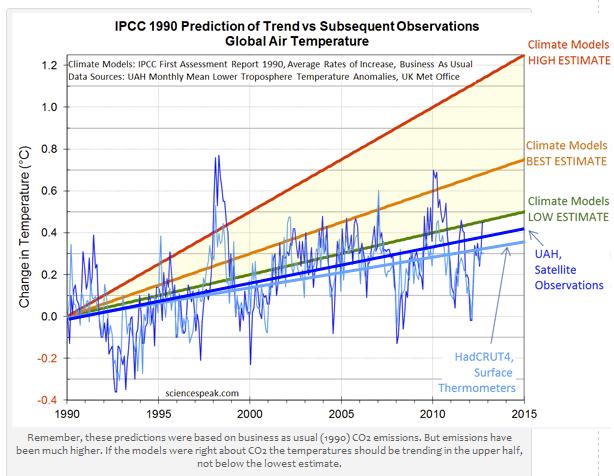
Further examinations of the failed IPCC “projections” can be found here: http://joannenova.com.au/2012/12/the-ipcc-was-wrong-england-and-the-abc-mislead-australians/
The following figure is from the above link showing the failed temperature projections.
The following figure is from the AR5 Chapter 12 – Figure 12.5 and shows “Time series of global and annual mean surface air temperature anomalies (relative to 1986–2005) from CMIP5 concentration-driven experiments. Projections are shown for each RCP for the multimodel mean (solid lines) and ±1 standard deviation across the distribution of individual models (shading).” The “RCP’s” are scenarios based on different levels of CO2 emissions (the only significant climate force in the models).
Given that the observations are at or below the models’ predictions over the last 25 years for the scenario involving no CO2 emissions growth in the 21st century, future warming can be expected to be in the blue range in the figure above.
See also: an examination of various alternative projections with better success so far than the IPCC: http://www.appinsys.com/GlobalWarming/GW_TemperatureProjections.htm
|
||||||||||
|
Global Sea Level Change Projections – Fail
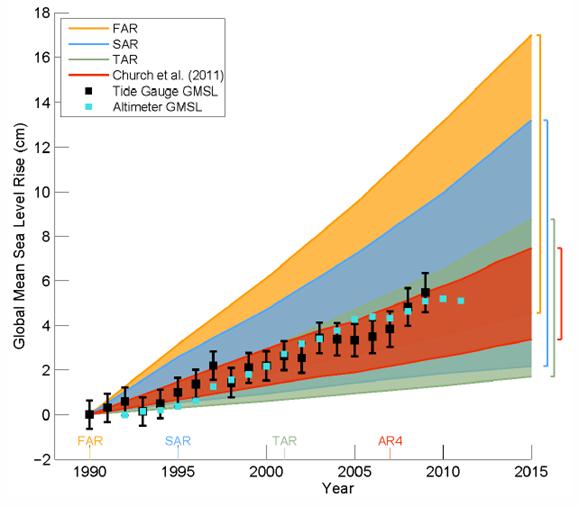
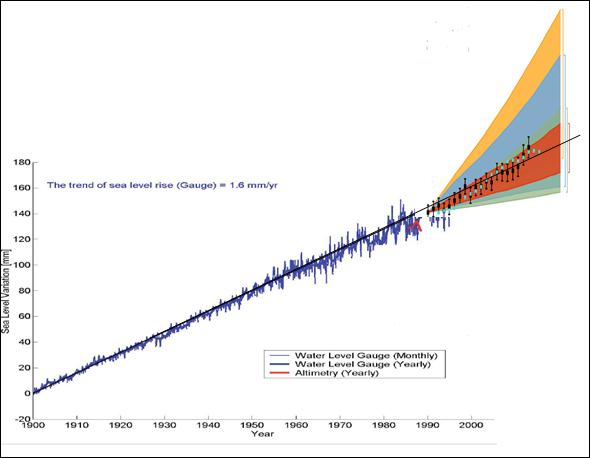
The following figure is from Chapter 1 of the AR5 report. The colored bands represent the sea level projections from each of the previous Assessment Reports, while the black dots indicate the observed sea level.
It’s interesting that the IPCC predicted exponential increases in sea level rise in the FAR and SAR reports and that each successive report resulted in lower future predictions, as shown in the following table. (A straight line projection of the actual data gives about 5 cm for 1990-2015.)
The IPCC stated in the Third Assessment Report (TAR-2001) [http://www.grida.no/climate/ipcc_tar/wg1/425.htm]: “There is no evidence for any acceleration of sea level rise in data from the 20th century data”.
(The AR5 figure explanation says: “Estimated changes in global annual sea level anomalies from tide gauge data (Church and White, 2011; available at http://www.cmar.csiro.au/sealevel/sl_data_cmar.html) (black error bars showing 1σ uncertainty) and based on annual averages from TOPEX and Jason satellites (Nerem et al., 2010; available at http://sealevel.colorado.edu/results.php) (blue dots) starting in 1992 (the values have been aligned to fit the 1993 value of the tide gauge data). The shading shows the largest model projected range of global annual sea level rise from 1990 to 2015 for FAR (Scenario D and business-as-usual), SAR (IS92c and IS92e), TAR (A2 and A1FI) and for Church et al. (2011) based on the CMIP3 model results available at the time of AR4 using the SRES A1B scenario.”)
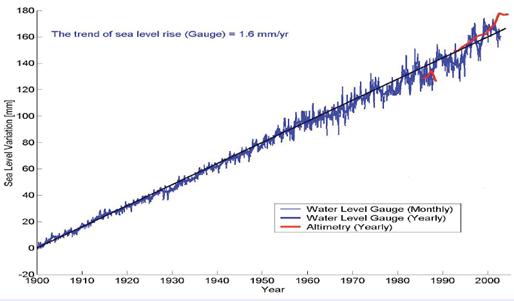
The following figure shows global cumulative sea level change for 1900 to 2002 [http://www.wamis.org/agm/meetings/rsama08/S304-Shum_Global_Sea_Level_Rise.pdf]. The trend has not increased in over 100 years.
The following figure combines the previous two figures. The rate of sea level increase remains unchanged in the historical record.
A 2012 NOAA report “The Budget of Recent Global Sea Level Rise 2005-2012” states: “The sum of steric sea level rise and the ocean mass component has a trend of 1.1 ± 0.8 mm/a over the period when the Paulson GIA mass correction is applied, well overlapping total sea level rise observed by Jason-1 and Jason-2 (1.3 ± 0.9 mm/a) within a 95% confidence interval.” These rates are less than the 20th century sea level rise rates. Also: “The regional patterns of sea level change, however, are many times larger and can be extremely complex. Steric sea level change is the dominant contributor to the spatial trend patterns observed for total sea level” In other words, the 20th century rate of 1.6 mm/year has declined to 1.1 – 1.3 mm/year in recent years.
The following figure shows the projections to the year 2100 from AR5 and shows “Projections from process-based models with likely ranges and median values for global-mean sea level rise and its contributions in 2081–2100 relative to 1986–2005 for the four RCP scenarios and scenario SRES A1B used in the AR4). Also shown is the observed sea level”.
The middle of the above model projections gives more than 50 cm of sea level rise by 2100. The following figure compaers the 50 cm projection with the past trend. This is a reversion back to the extreme predictions from the First Assessment Report that already failed the 25-year prediction from 1990-2015.
See also: an examination of sea level data: http://www.appinsys.com/GlobalWarming/GW_4CE_SeaLevel.htm
And alarmist sea level claims by politicians: http://www.appinsys.com/GlobalWarming/SeaLevelRising.htm
|
||||||||||
|
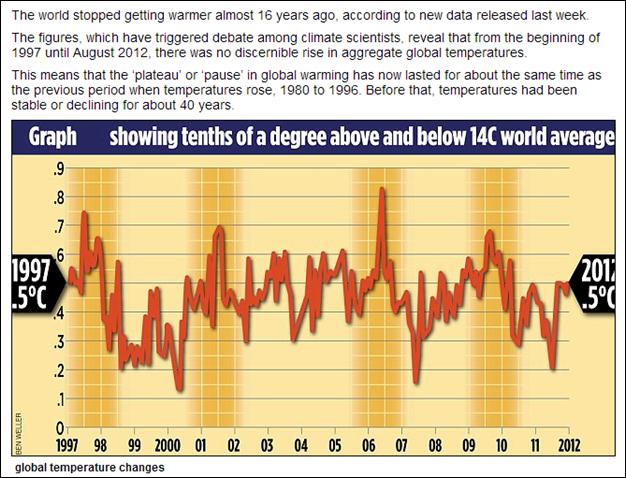
The Non-Warming Period is Now Almost as Long as the Recent Warming Period
The following figure shows the global temperature anomaly for the past 16 years. [http://www.dailymail.co.uk/sciencetech/article-2217286/Global-warming-stopped-16-years-ago-reveals-Met-Office-report-quietly-released--chart-prove-it.html#ixzz29E78OR9H]
According to NOAA 2008 State of the Climate report, regarding climate models (which are based on CO2 for driving the warming): “Near-zero and even negative trends are common for intervals of a decade or less in the simulations, due to the model’s internal climate variability. The simulations rule out (at the 95% level) zero trends for intervals of 15 yr or more, suggesting that an observed absence of warming of this duration is needed to create a discrepancy with the expected present-day warming rate.” [http://www1.ncdc.noaa.gov/pub/data/cmb/bams-sotc/climate-assessment-2008-lo-rez.pdf]
In other words, the current observed period of 16 years with no warming indicates the climate models have severe problems, and thus the influence of CO2 on climate is over-guesstimated.
|
||||||||||
|
|