Geomagnetic Storm Occurrence and Temperature Regime Change
|
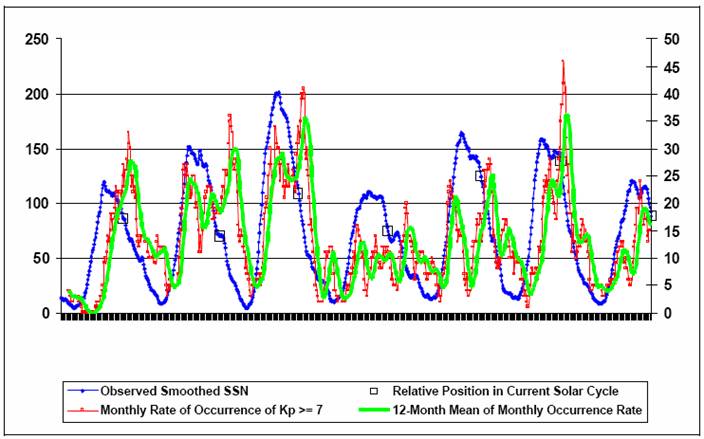
The following figure shows the monthly rate of occurrence of geomagnetic storms with Kp > 7 (red) and the 12-month moving average of the same (green), along with sun spot number (blue) [http://www.spacew.com/gic/guidance.pdf]
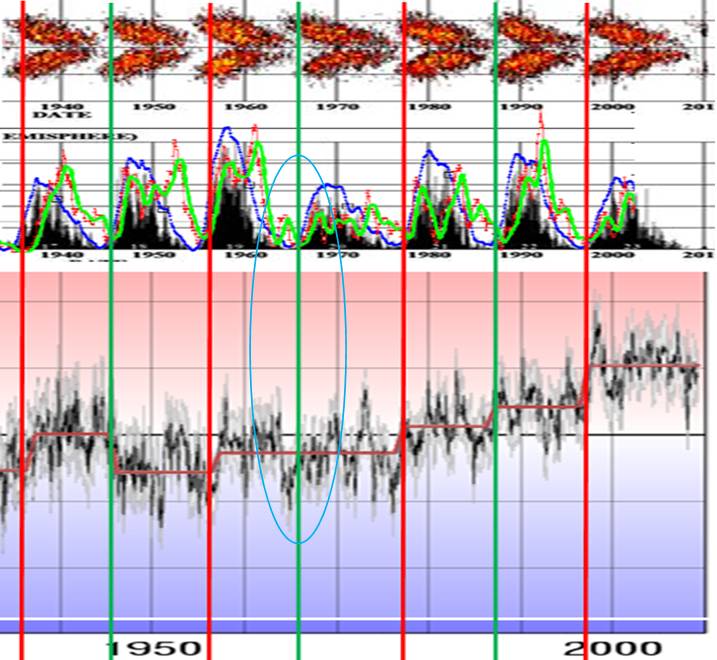
The following figure combines the above graph with the regime change graph from http://www.appinsys.com/GlobalWarming/ClimateRegimeShift.htm
An interesting coincidence: the temperature regime shifts occur when the decreasing geomagnetic storm rate crosses the increasing sun spot number.
The only solar cycle without an identified regime shift at its onset is solar cycle 20, starting in 1966. It is coincidental that the decreasing geomagnetic storm rate occurs earlier than usual and it makes a double dip. This is highlighted by the blue circle.
|