Global Warming Science - www.appinsys.com/GlobalWarming
Australia Flooding – January 2011
[last update: 2011/03/29, prev. 2011/03/02]
|
Eastern Australia Flooding
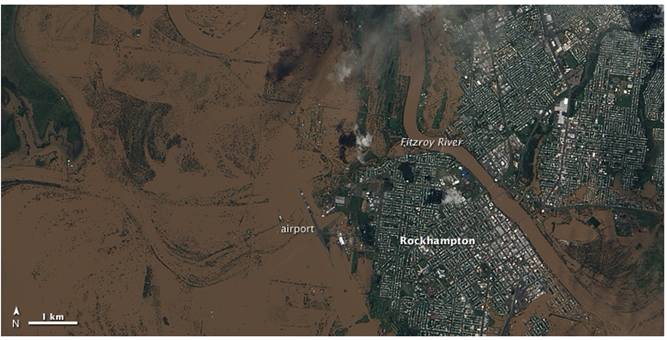
“Heavy rains in Queensland, Australia, pushed the Fitzroy River over its banks at the beginning of 2011. The overflowing river submerged much of Rockhampton, not far from the Queensland coast. … The image from January 9 shows the city largely overrun by flood water, especially west of the river. Thick with sediment, the water is muddy brown, and only isolated patches of land, developed or otherwise, rise above it. The airport is completely submerged.” [http://earthobservatory.nasa.gov/IOTD/view.php?id=48916]
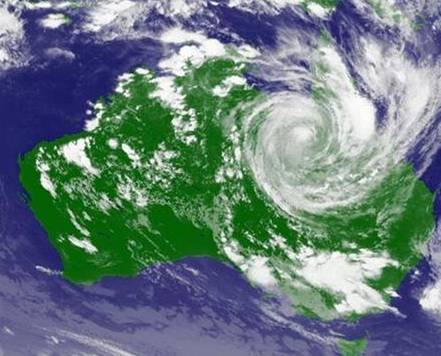
Then Cyclone Yasi hit at the end of January, bringing even more extensive flooding.
(image from http://www.reuters.com/article/2011/02/10/us-climate-cyclones-idUSTRE7191Y920110210)
In accordance with their alarmist editorial policy, the above article in Reuters claimed “Stronger cyclones to menace miners, crops in warmer world -- Witnesses to Cyclone Yasi's destructive tear across northeastern Australia described it as a monster for its size and ferocity. It was also an omen.” (Reuters is one of the biggest global warming propaganda machines – see: http://www.appinsys.com/GlobalWarming/ReutersAlarm.htm)
|
|
Australia Tropical Cyclone Trends
The total number of tropical cyclones in the Australia region has been decreasing during the “warming era”, as shown in the following figure. [http://www.bom.gov.au/cyclone/climatology/trends.shtml] This source also states: “Since that time [2001] there has been a growing number of studies that indicate a consistent signal of fewer tropical cyclones globally in a warmer climate“. (Although, as usual, a problem with climate models: “there is large uncertainty in the future change in tropical cyclone frequency projected by climate models” and “the highest resolution models show evidence of an increase in tropical cyclone intensity in a warmer world”, contrary to the data).
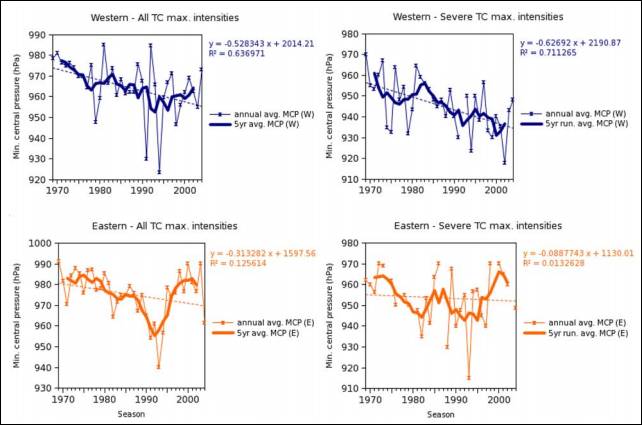
The following figures show tropical cyclone (TC) maximum intensity by region (top: Western Australia, bottom: Eastern Australia) and for all TC (left) and sever TC (right). [http://www.earthbyte.org/people/patrice/Teaching/Geos-2111GIS/Ref/Hassim-G3-08-OZCyclone.pdf] “both sectors show statistically significant, long-term downward trends in average MCP”
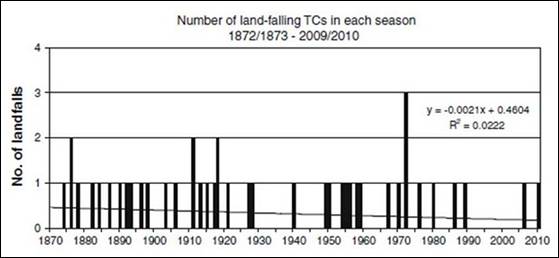
A 2010 paper (Callaghan and Power, “Variability and decline in the number of severe tropical cyclones making land-fall over eastern Australia since the late nineteenth century”, Climate Dynamics), states: “The linear trend in the number of severe TCs making land-fall over eastern Australia declined from about 0.45 TCs/year in the early 1870s to about 0.17 TCs/year in recent times—a 62% decline. This decline can be partially explained by a weakening of the Walker Circulation, and a natural shift towards a more El Niño-dominated era. The extent to which global warming might be also be partially responsible for the decline in land-falls—if it is at all—is unknown.” [http://www.springerlink.com/content/b073428q37741816/] The following figure is from their paper.
The Australian is apparently not alarmist like the EU and US media: “What the longer term records show, however, is that the frequency of extreme cyclones follow a predictable long-scale pattern. "What the record shows is we go through extended periods, hundreds of years, of high activity and extended periods of little activity," Nott says. "The past 100 to 150 years has been very quiet in Queensland in terms of what happened in the past. The couple of hundred years prior to that were very active." According to shorter term decadal scale-that uses a 10-year cycle- Queensland can also expect a big increase in the number of severe cyclones.“
|
|
Alarmists Blame it on Global Warming
The usual string of alarmist media outlets blamed Yasi and the Australian flooding on global warming (besides Reuters, the Guardian, the Huffington Post, etc.).
From the article: “as more energy and moisture is put into the atmosphere [by warming], the likelihood of storms, hurricanes and tornadoes increases” Oops – they forgot to look at the actual data.
At least they blamed the pre-Yasi flooding on La Nina, although they imply that global warming is somehow affecting that too: “The strongest La Niña in a century was also blamed for the recent terrible floods in Queensland. (La Niña is a periodic climate phenomenon that brings more rain to the western Pacific and less to South America along the eastern Pacific.) But scientists do not yet know how global warming is affecting La Niña and its counterpart, El Niño.” (Not if it is but how it is affecting it).
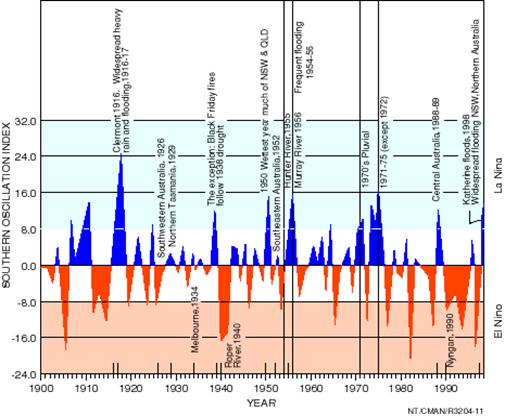
Strongest La Nina in a century? What about 1955? Or 1974?
[http://www.esrl.noaa.gov/psd/people/klaus.wolter/MEI/]
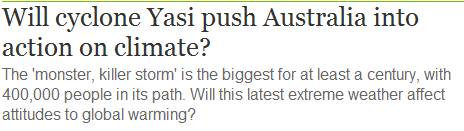
The Guardian finishes the article with “Will the Lucky country, with one of world's biggest per capita carbon footprints and the world's biggest exporter of coal, reverse its increasingly sceptical attitude to global warming and take action to cut greenhouse gas emissions?” – Answer: hopefully not, since the alarmists ignore the actual data in hopes that their anecdotes will be taken as “omens” for the global warming faithful.
And the Guardian’s straw man of “per-capita carbon footprint” is another misleading deception. If Australia’s population of 21 million reduced their per-capita emissions to zero, it would have zero impact (if CO2 had an impact) – since China, with its much lower per-capita emissions has such huge emissions. Australia’s 0.37 million metric tonnes per year = 5 percent of China’s 6.54 million metric tonnes per year. [http://en.wikipedia.org/wiki/List_of_countries_by_carbon_dioxide_emissions]
|
|
Australian Flooding and La Nina
Non-cyclone floods in Australia (such as in Queensland shown at the start of this article) are typical for strong La Nina episodes.
“La Niña years of 1916, 1917, 1950, 1954 through 1956, and 1973 through 1975, were accompanied by some of the worst and most widespread flooding this century. It can safely be said that, over much of Australia, flooding is more likely than usual during La Niña years, and less likely in El Niño years, though heavy rain and flooding often accompany the breakdown of El Niño in late summer or autumn.” [http://www.bom.gov.au/lam/climate/levelthree/c20thc/flood.htm]
The following figure shows the correspondence of major Australian flood episodes to the Southern Oscillation Index – La Nina episodes are indicated in blue.
“The current La Niña in the Pacific Ocean, one of the strongest in the past 50 years, … For Australia, La Niña typically means above-average rains, and the current La Niña is no exception. Heavy rains that began in late December led to the continent's worst flooding in nearly a half century” [http://www.nasa.gov/topics/earth/features/lanina20110107.html]
|
|
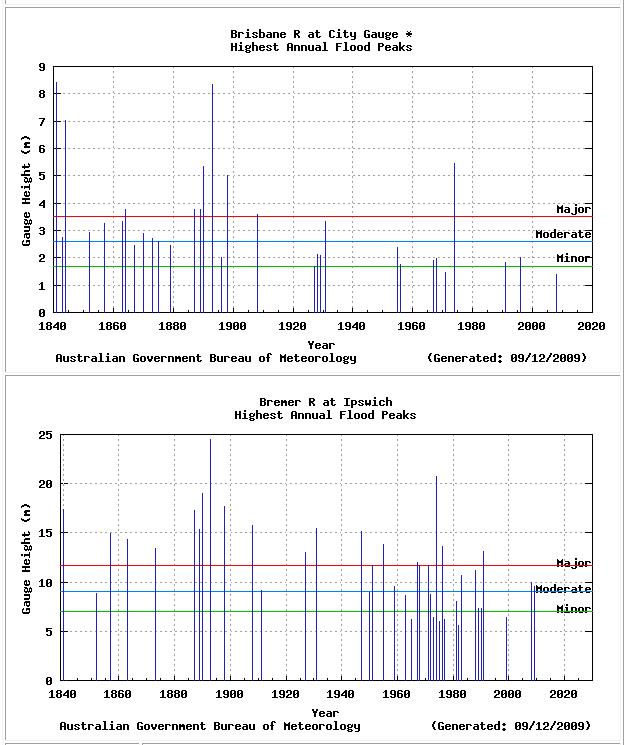
Brisbane Flood History
The following figures show the flood history for the Brisbane River basin. Overall, a downward trend as the earth warms. [http://www.bom.gov.au/hydro/flood/qld/fld_history/brisbane_history.shtml]
Update March 29, 2011:
|
|
Despite the alarmists’ claims, the actual data show a decrease in tropical cyclones and flooding in Australia during the global warming era. That’s inconvenient.
|
|
|