Global Warming Science: www.appinsys.com/GlobalWarming
Reuters – Creating Alarm Regardless of Facts
[last update: 2011/03/01]
|
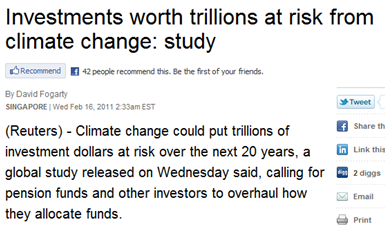
Reuters Alarm – Investments At Risk
[http://www.reuters.com/article/2011/02/16/us-climate-investment-risks-idUSTRE71F1CO20110216]
But what does the source report cited by Reuters actually say? [http://uk.mercer.com/articles/1406410]
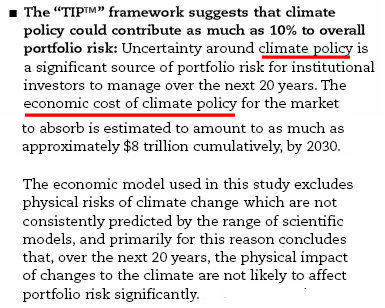
Unlike Reuters’ misrepresentation of the issue of risk due to “climate change”, the actual report is about risk due to “climate policy”. In other words, climate change is not causing a risk, government policies trying to respond to the issue are the real risk.
Governments create risk, Reuters creates alarm.
|
|
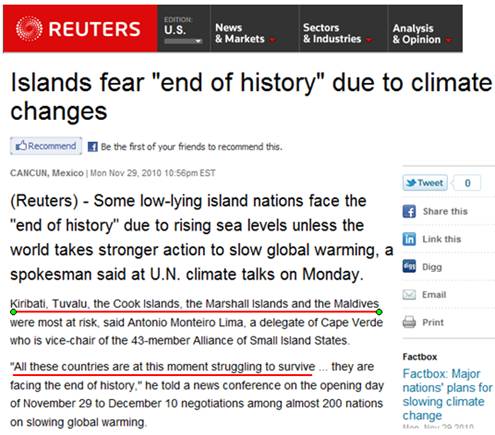
Reuters Alarm – Island Nations Face End of History
[http://www.reuters.com/article/2010/11/30/us-climate-islands-idUSTRE6AT0KW20101130]
Reuters provided no fact-checking, just reporting of lies.
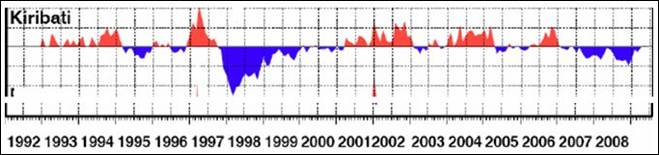
Kiribati
The Australian government operates a sea level station in Kiribati. The following figure shows the last available report (through mid-2009) showing sea level anomalies for 1993 through June 2009. [http://www-cluster.bom.gov.au/ntc/IDO60102/IDO60102.2009_1.pdf] Each grid line is 0.1 m on the vertical scale with the zero being the line above which positive anomalies are colored red and negative anomalies, blue.
Note that the 1998 El Nino caused a sea level drop of almost 25 cm (10 inches). There is no significant sea level rise in Kiribati.
The UK’s Telegraph reported:
“Scientists have been surprised by the findings, which show that some islands have grown by almost one-third over the past 60 years. Among the island chains to have increased in land area are Tuvalu and neighbouring Kiribati … In Kiribati, the three of the most densely populated islands, Betio, Bairiki and Nanikai, also grew by between 12.5 and 30 per cent. … "Eighty per cent of the islands we've looked at have either remained about the same or, in fact, got larger.” "We've now got evidence the physical foundations of these islands will still be there in 100 years," he told New Scientist magazine. “It has long been thought that as the sea level goes up, islands will sit there and drown. But they won't," Professor Kench said.”
(See also: http://www.appinsys.com/GlobalWarming/Kiribati.htm)
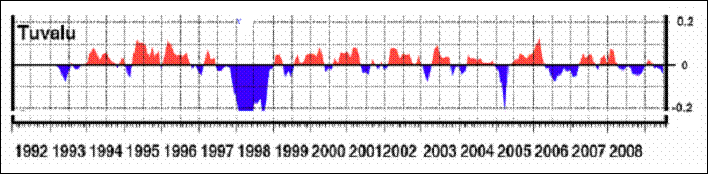
Tuvalu
The following figure shows the last available report (through mid-2009) showing sea level anomalies for 1993 through June 2009. [http://www-cluster.bom.gov.au/ntc/IDO60102/IDO60102.2009_1.pdf] No significant sea level rise.
(See also: http://www.appinsys.com/GlobalWarming/RS_Oceania.htm)
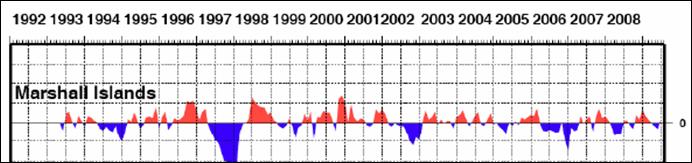
Marshall Islands
The following figure shows the last available report (through mid-2009) showing sea level anomalies for 1993 through June 2009. [http://www-cluster.bom.gov.au/ntc/IDO60102/IDO60102.2009_1.pdf] No significant sea level rise.
Maldives
According to Invest Maldives (“the government agency entrusted with promoting, regulating and licensing foreign investments in the country”) [http://investmaldives.org/investment_environment/economic_profile.html]:
“In response to the perceived threat from sea level rise, the Government of Maldives has begun construction of a 3-m high gabion seawall around Male with the help of a $30 million grant from Japan. Although this reaction is understandable, it may be questioned. Projections of rates of sea level rise in the next century, although undoubtedly subject to errors, suggest that healthy reefs will be able to keep pace. … The best breakwater for an atoll is a healthy reef. Sewage input causes reef bioerosion rates to increase dramatically and therefore, constructed seawalls will be undermined by sewage. (See: http://www.appinsys.com/GlobalWarming/ClimateCash.htm#maldives)
Reuters: bogus alarm.
|
|
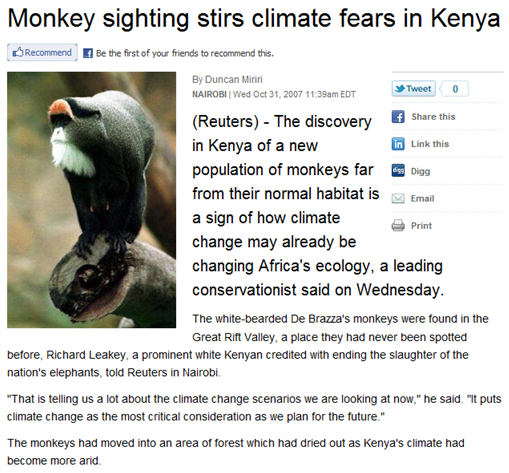
Reuters Alarm – Discovery of Monkeys Blamed on Global Warming
[http://www.reuters.com/article/2007/10/31/environment-kenya-monkeys-dc-idUSL3183792220071031]
Note that Reuters implies they moved in response to global warming: “moved into an area of forest which had dried out as Kenya’s climate had become more arid.” (Actually the monkeys were found in Matthews Range – not in the Rift Valley, and they moved there more than 8,000 years ago, before the Rift Valley became arid).
According to the Institute of Primate Research “A New Population of De Brazza’s Monkey in Kenya”, Iregi Mwenja, Primate Conservation, 2007 [http://www.primate-sg.org/PDF/PC22.new.neglectus.V2.pdf]: “Until recently, de Brazza’s monkey (Cercopithecus neglectus) was not known to occur east of the Great Rift Valley in Kenya. However, after eight months of intensive surveys in the remote and isolated Mathews Range Forest Reserve of Samburu, we were able to count a total of 162 de Brazza’s monkeys in 24 groups … The most affected habitats are those near human settlements on the lower altitudes (where 75% of the total population of de Brazza’s monkeys occurs) since they are easily accessible. During the onset of the dry season and periods of drought, communities invade these areas with large herds of livestock, where they feed them on leaves of evergreen tree species such as Faidherbia albida, Ficus sp., and Olea sp. The people cut the branches almost denuding the tree. These species are important in the diet of de Brazza’s monkey. The study resulted in the first record of de Brazza’s monkeys occurring above 2,100 m above sea level. They were seen in Olkaela in the Mathews range at an elevation of 2,203 m.”
The De Brazza’s monkey is common in the main part of its range (Cameroon, Equatorial Guinea and Angola) but rare in Kenya. Over the years as its range in Kenya was investigated, its known range has continued to expand: “Prior to a report by Booth (1962), the species was believed to be restricted to the western slopes of Mt. Elgon. Booth (1962) reported that it also occurred 60 km further east in the Cherangani Hills. Its range was found to extend northwards to southwest Ethiopia by Brown and Urban in 1969 (Wahome, 1993). Brennan (1984) found further groups in the western range of the species, between Mt. Elgon and Cherangani, while Wahome (1989) extended its southern range to Kisere forest, north of Kakamega forest. Mwenja (2004) added more new sightings in the region; more than tripling the known population in Kenya. Douglas-Dufresne (2005) reported a new population of the species in the Mathews Range, the first found east of the Rift Valley: before then, the species was believed to be restricted to western Kenya (Brennan 1985; Decker 1995; Karere 1995).” (From the same paper cited above).
Although Reuters tries to create a climate change alarm, the known De Brazza’s population in Kenya has increased as the average global temperature has increased – a positive (although irrelevant) correlation. Reuters’ alarmist stance hides the actual problem: “In Kenya, threats to the survival of de Brazza’s monkey arise mainly from the rampant deforestation caused by the ever-increasing demand for firewood, timber and farmland, and accompanying growth of human settlements. Their diminishing forests result in small populations, reduced opportunities for dispersal, and heightened competition from other species (Brennan 1984; Olubayo 1998). Those that have survived have been, and continue to be, pushed to higher altitudes along the rivers, or are left in small, isolated remnant habitats that cannot sustain them, and expose them to poaching (Mwenja 2004). Today, the majority of the population is spread through very thin, increasingly fragmented, strips of riparian forest on private farms; usually in small, isolated groups.” (From the same paper cited above).
Prior to the discovery of this De Brazza’s population in the Matthews range, the De Brazza’s future looked grim in Kenya – but NOT due to global warming: “The pressures now facing this population are loss of habitat, reproductive isolation, and a decline in numbers as the result of being killed, either as a food source or as agricultural pests. If the current situation continues and no attempt is made to conserve the remaining De Brazza's monkeys, the species faces almost certain extinction in Kenya.” [http://onlinelibrary.wiley.com/doi/10.1002/ajp.1350080402/abstract]
National Geographic states: “Hundreds are killed for crop raiding and bush meat through poisoning, traps, and the use of dogs.” [http://news.nationalgeographic.com/news/2007/11/071105-monkeys_2.html]
National Geographic says: “Today the Rift Valley is arid. Trees are sparse. But not so long ago, De Brazza's must have lived there, he [Leakey] said. "For the De Brazza's to appear as far east—150 kilometers across the Rift Valley—it implies that there was some fairly continuous natural habitat or swampy ground across the Rift Valley until relatively recently," Leakey said. "This complete disappearance of that forest belt must be in the last 8,000 years.” (From same NG article cited above).
This shows just how misleading the Reuters version is – Leakey refers to climate change during the last 8,000 years causing the Rift Valley to become arid. Reuters makes it sound like the monkeys are anthropogenic global warming refugees. Reuters gets two basic facts wrong: the monkeys were found in the Matthews Range not in the Rift Valley, and they did not move “into an area of forest which had dried out” – they moved there before the valley in between dried out.
|
|
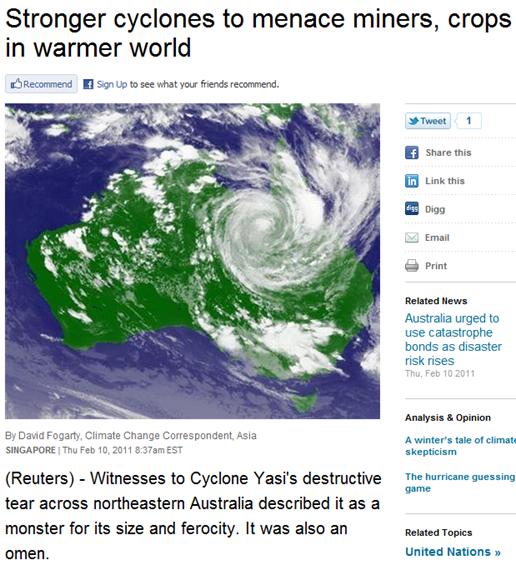
Reuters Alarm – Hurricanes / Cyclones Blamed on Global Warming
[http://www.reuters.com/article/2011/02/10/us-climate-cyclones-idUSTRE7191Y920110210]
From the Reuters article: “Since the early 1990s, we have seen a significant increase in the number of hurricanes in the Atlantic”, and later in the article “It is a grim picture. Even if the number of storms is not increasing” The Reuters article provides brief information about a few individual nasty hurricanes – but what it doesn’t provide is actual scientific data.
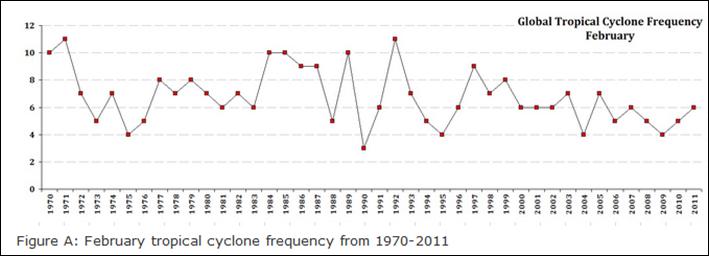
Global Cyclones / Hurricanes
The following figure shows global hurricane frequency during the global warming era.
[http://www.coaps.fsu.edu/~maue/tropical/]
(See also: http://appinsys.com/globalwarming/GW_4CE_Hurricanes.htm)
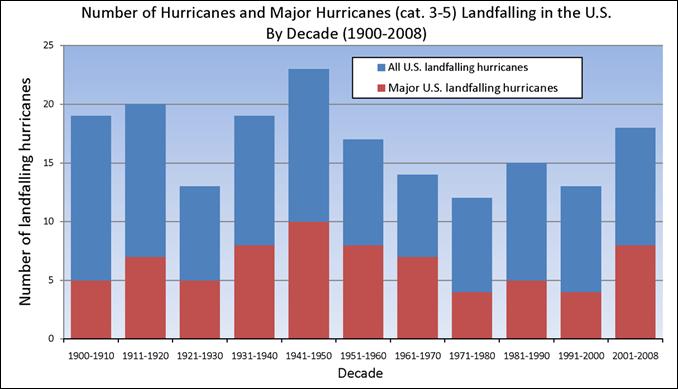
Atlantic Hurricanes
The following figure shows the number of landfalling hurricanes in the US by decade.
[http://www.ncdc.noaa.gov/img/climate/research/hurricanes/us-hurricanelandfall-fig4-por-2008.gif]
The global warming decades of 1980s and 1990s had the fewest hurricanes, with an increase in the 2000s (which NOAA attributes to a natural cycle – see: [http://www.magazine.noaa.gov/stories/mag184.htm] which states: “NOAA attributes this increased activity to natural occurring cycles in tropical climate patterns near the equator. These cycles, called “the tropical multi-decadal signal,” typically last several decades (20 to 30 years or even longer). As a result, the North Atlantic experiences alternating decades long (20 to 30 year periods or even longer) of above normal or below normal hurricane seasons. NOAA research shows that the tropical multi-decadal signal is causing the increased Atlantic hurricane activity since 1995, and is not related to greenhouse warming.”
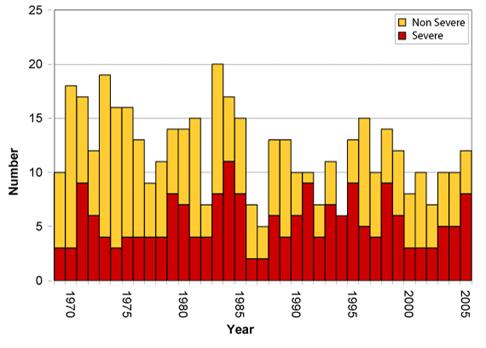
Tropical Cyclones in Australia
The total number of tropical cyclones in the Australia region has been decreasing during the “warming era”, as shown in the following figure. [http://www.bom.gov.au/cyclone/climatology/trends.shtml] This source also states: “Since that time [2001] there has been a growing number of studies that indicate a consistent signal of fewer tropical cyclones globally in a warmer climate“. (Although, as usual, a problem with climate models: “there is large uncertainty in the future change in tropical cyclone frequency projected by climate models” and “the highest resolution models show evidence of an increase in tropical cyclone intensity in a warmer world”, contrary to the data).
(See also: http://appinsys.com/GlobalWarming/AustraliaFlood_Jan2011.htm for more info on tropical cyclones in Australia)
Another Reuters false alarm.
|
|
Reuters can be trusted to twist the facts, ignore most facts, and create alarmist scenarios blaming global warming for imaginary negative impacts.
|
|
|

