Global Warming Science - www.appinsys.com/GlobalWarming
Arctic Cycles – Related to AMO/PDO, Not CO2
[last update: 2011/05/21]
|
Arctic Temperature
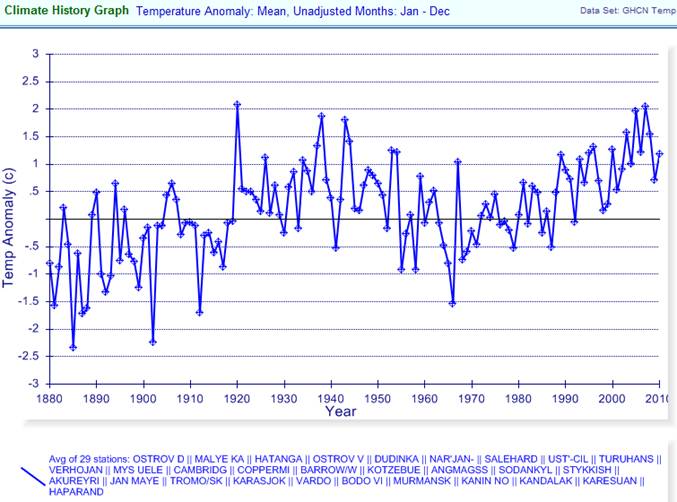
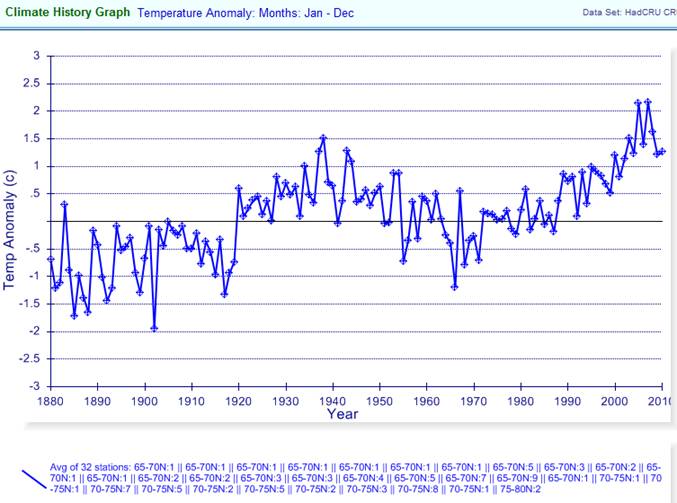
The following figures compare the annual average temperature anomaly data for the Arctic for NOAA GHCN (unadjusted) and Hadley CRUTEM3 (adjusted and averaged over 5x5 degree grids) through 2010. All stations or grids north of 65N with data extending from before 1930 to after 2000 have been included. (Plotted at www.appinsys.com/GlobalWarming/Climate.aspx)
GHCN – 29 stations
CRUTEM3 – 32 5x5 grids
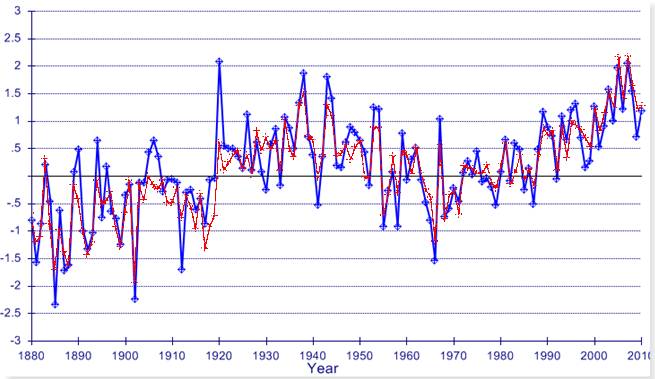
The following figure compares the above two figures with GHCN in blue and CRUTEM3 in red. Hadley/CRU adjustments result in reduction in past warm years in the 1920s-1940s and slightly warmer temperatures in the mid-2000s.
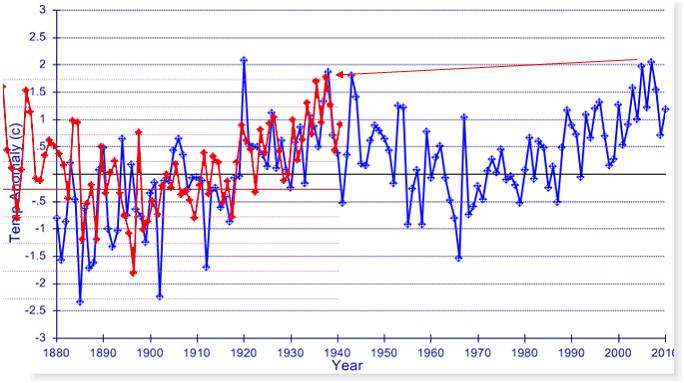
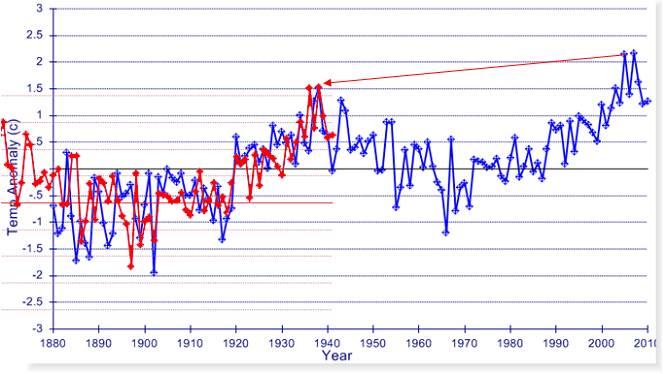
The following figure shows the GHCN temperature anomaly data (blue) along with the same data shifted back 69 years and down 0.3 degrees (red).
The following figure shows the CUTEM3 temperature anomaly data (blue) along with the same data shifted back 69 years and down 0.6 degrees (red).
This shows the similarity of the cycles and may portend 25 years of cooling before the warming resumes.
|
|
Hansen Says It’s Natural
NASA’s James Hansen (Hansen et al 2007 “Climate simulations for 1880–2003 with GISS modelE” Clim Dyn (2007) 29:661–696 [http://pubs.giss.nasa.gov/docs/2007/2007_Hansen_etal_3.pdf]) observed that the climate model was not correctly simulating the 1930s-1940s warm period in the global average temperature: “It may be fruitless to search for an external forcing to produce peak warmth around 1940. It is shown below that the observed maximum is due almost entirely to temporary warmth in the Arctic. Such Arctic warmth could be a natural oscillation (Johannessen et al. 2004), possibly unforced. Indeed, there are few forcings that would yield warmth largely confined to the Arctic. Candidates might be soot blown to the Arctic from industrial activity at the outset of World War II, or solar forcing of the Arctic Oscillation (Shindell et al. 1999; Tourpali et al. 2005) that is not captured by our present model. Perhaps a more likely scenario is an unforced ocean dynamical fluctuation with heat transport to the Arctic and positive feedbacks from reduced sea ice.”
So Hansen asserts that the previous warming cycle was natural (perhaps “solar forcing of the Arctic Oscillation”), but the current warming cycle is due to CO2. And yet the current “global” warming has also been “largely confined to the Arctic”.
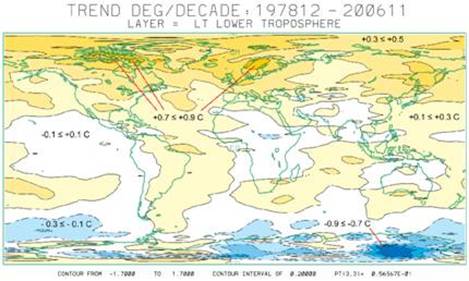
The following figure shows the global temperature change from 1978 to 2006 for the lower troposphere from satellite data [http://climate.uah.edu/25yearbig.jpg]. Most of the warming has been in the Arctic.
The following figure is from the IPCC Fourth Assessment Report (AR4) Figure 9.6 (2007). It shows the change in temperature (C per decade) by latitude. The black line shows the observed temperature, the blue band shows the output of the computer models including only natural factors, whereas the pink band shows the output of computer models including anthropogenic CO2. Notice that the models without CO2 (blue shaded area) can explain all of the warming for most of the world up to 30 degrees north latitude. This figure also shows that the warming is mainly in the Arctic.
So it is Hansen’s and other alarmists’ position that these two nearly identical Arctic warming cycles have two completely different causes – 1930s = natural; 1990s = CO2.
(See Global Warming is Not Global for more details about the non-global trends)
(See Arctic Regional Summary for more details on the Arctic)
|
|
Oceanic Oscillations
It is only in recent years that scientists are starting to recognize the influence of oceanic cycles in influencing climate. A 2008 study – “Oceanic Influences on Recent Continental Warming”, by Compo et al in Climate Dynamics, 2008) [http://www.cdc.noaa.gov/people/gilbert.p.compo/CompoSardeshmukh2007a.pdf] states: “Evidence is presented that the recent worldwide land warming has occurred largely in response to a worldwide warming of the oceans rather than as a direct response to increasing greenhouse gases (GHGs) over land. Atmospheric model simulations of the last half-century with prescribed observed ocean temperature changes, but without prescribed GHG changes, account for most of the land warming. … Several recent studies suggest that the observed SST variability may be misrepresented in the coupled models used in preparing the IPCC's Fourth Assessment Report, with substantial errors on interannual and decadal scales. There is a hint of an underestimation of simulated decadal SST variability even in the published IPCC Report.”
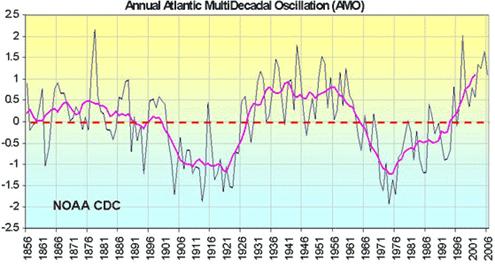
The Atlantic Multi-Decadal Oscillation (AMO) is a fluctuation in de-trended sea surface temperatures in the North Atlantic Ocean. It was identified in 2000 and the AMO index was defined in 2001 as the 10-year running mean of the de-trended Atlantic SST anomalies north of the equator.
The following figure shows the AMO [http://intellicast.com/Community/Content.aspx?a=127].
The following figure superimposes the Arctic average annual temperature anomaly (CRUTEM3 - blue) on the AMO.
The following figure superimposes the Arctic average annual temperature anomaly (GHCN - green) on the AMO (AMO graph from [http://en.wikipedia.org/wiki/File:Amo_timeseries_1856-present.svg]).
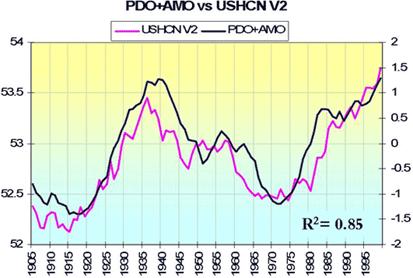
The following figure shows the sum of the AMO plus the Pacific Decadal Oscillation (PDO) [http://intellicast.com/Community/Content.aspx?a=127] (black line).
The following figure shows the AMO+PDO (black line above changed to red below) superimposed on the Arctic average annual temperature shown at the beginning of this document.
The above figures show the clear correlation of the Arctic temperature cycles to the oceanic oscillations.
For more info: AMO: http://appinsys.com/globalwarming/AMO.htm PDO: http://appinsys.com/globalwarming/PDO.htm
|
|
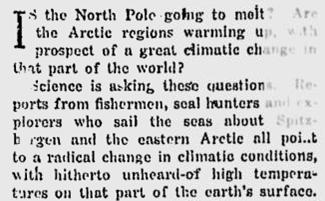
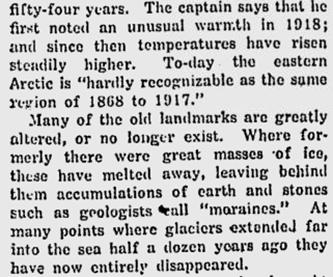
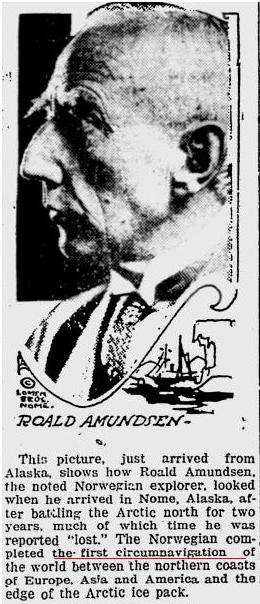
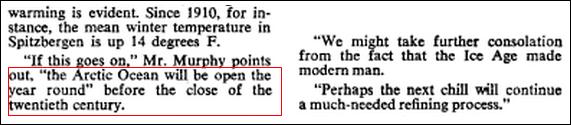
Historical Observations
Pittsburg Press, Dec. 3, 1922: [http://news.google.com/newspapers?nid=djft3U1LymYC&dat=19221203&printsec=frontpage] (go to page 92)
The Evening Independent, Sep. 10, 1920: [http://news.google.com/newspapers?nid=PZE8UkGerEcC&dat=19200910&printsec=frontpage] (page 7)
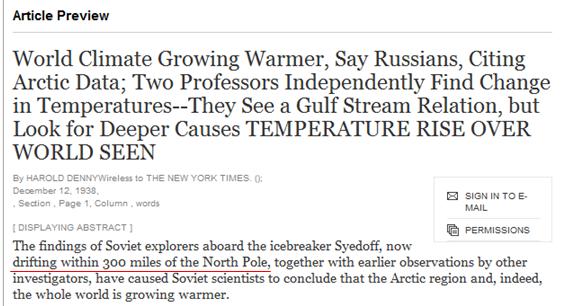
New York Times, Dec. 12, 1938: [http://select.nytimes.com/gst/abstract.html?res=F40D14F63C5F1B7A93C0A81789D95F4C8385F9]
Thanks to Steven Goddard at http://stevengoddard.wordpress.com/ for digging these up.
|
|
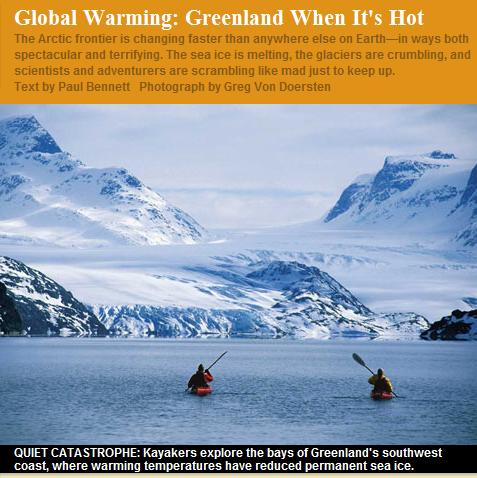
National Geographic Alarmism
[http://www.nationalgeographic.com/adventure/adventure-travel/greenland/global-warming.html]
The NatGeo creates alarm about recent Arctic warming, but ignores the long term data showing that this is a repeated cycle.
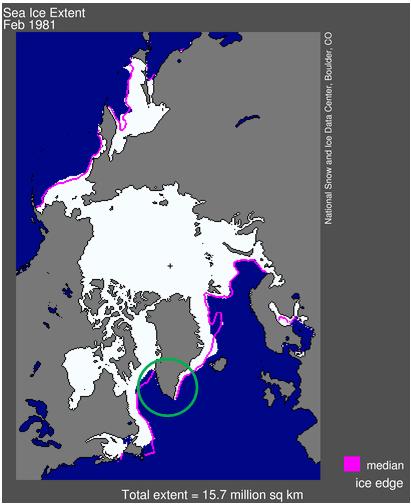
They also make the false claim “the bays of Greenland’s southwest coast, where warming temperatures have reduced permanent sea ice.” – southwest Greenland never had permanent sea ice as shown below. The magenta line shows the median area of sea ice.
[ftp://sidads.colorado.edu/DATASETS/NOAA/G02135/Feb/N_198102_extn.png]
See also: http://www.appinsys.com/GlobalWarming/RS_Greenland.htm
|
|
Tiny Tim – A New Scientist
New Scientist magazine, December 1960:
Tiny Tim sings “The ice caps are melting … all the world is drowning to wash away the sin” (forerunner of the green religion).
http://www.youtube.com/watch?v=8DEoOdcYKbc&feature=player_embedded
|
|
|

