Global Warming Science - www.appinsys.com/GlobalWarming
The Arctic Sea Ice Retreat of 2007
[last update: 2010/05/28]
|
The summer Arctic Sea Ice has been decreasing over the last couple of decades. In 2007 there was a very anomalous decrease which resulted in many mainstream media predictions for Arctic sea ice to be completely gone within a few years and of course, attribution to anthropogenic CO2-based global warming.
It is important to keep in mind the fact that consistent observations of the Arctic sea ice and related conditions have only been made since 1979 when satellite observations began.
|
||
|
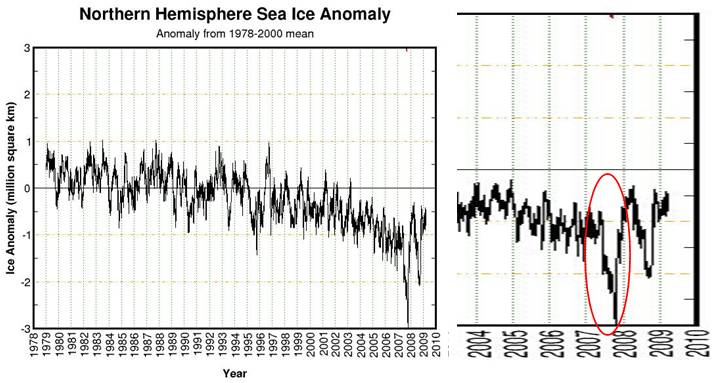
The following figure shows the northern hemisphere sea ice anomalies from 1979 to March 2009 [http://arctic.atmos.uiuc.edu/cryosphere/] The right-hand figure shows the 2007 time frame expanded and circled in red.
NASA reported (Oct 2007) [http://www.nasa.gov/vision/earth/lookingatearth/quikscat-20071001.html]: “the rapid decline in winter perennial ice the past two years was caused by unusual winds. "Unusual atmospheric conditions set up wind patterns that compressed the sea ice, loaded it into the Transpolar Drift Stream and then sped its flow out of the Arctic," he said. When that sea ice reached lower latitudes, it rapidly melted in the warmer waters.”
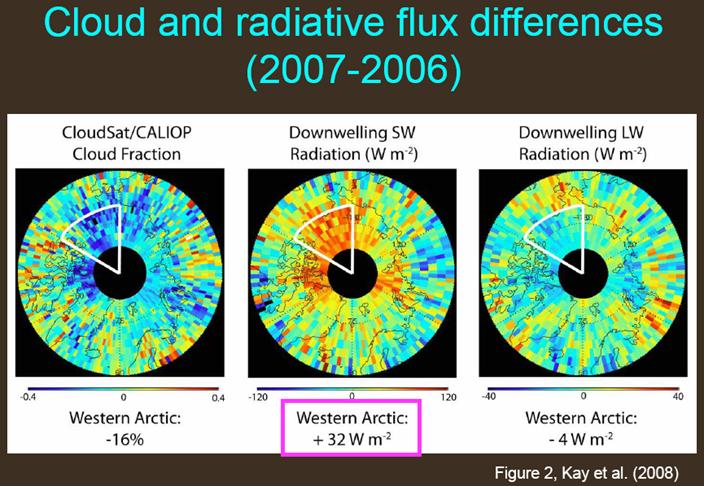
NASA Earth Observatory (Dec 2007) reported [http://earthobservatory.nasa.gov/Newsroom/NasaNews/2007/2007121225985.html]: “Using data from CloudSat and NASA’s Cloud-Aerosol Lidar and Infrared Pathfinder Satellite Observation satellite, they found the total cloud cover over the western Arctic, where most of the ice loss occurred, was 16 percent less over the 2007 melt season than in 2006. The resulting clearer skies in 2007 heated the Arctic surface enough to warm ocean waters by 2.4 degrees Celsius (four degrees Fahrenheit) or enough to melt 0.3 meters (one foot) of sea ice.”
Researchers at the University of Washington reported [http://www.sciencenews.org/articles/20071222/fob2.asp]: “In parts of the Arctic Ocean this year [2007], sea surface temperatures were 3.5°C warmer than average and a full 1.5°C warmer than previously recorded highs, says Michael Steele, also of the University of Washington in Seattle. All that warm water chewed away at Arctic ice from below. In some parts of the Beaufort Sea , north of Alaska and western Canada, ice that started the summer 3.3 m thick ended up measuring just 50 centimeters. About 70 cm of that shrinkage resulted from melting of the ice's upper surface—a typical amount for the summer, says Perovich. However, a whopping 2 m or so of that erosion, about five times the normal summer loss, occurred from below”.
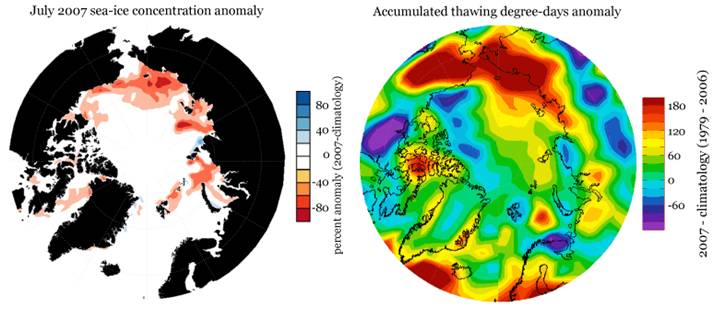
The following figures show the July 2007 sea-ice concentration anomaly (left) and the January – July 2007 accumulated thawing degree-days anomaly (right) [http://ccar.colorado.edu/arifs/pan_arctic.html]. These anomalies resulted from the influx of warm Pacific water from the Bering Sea to the Chukchi Sea.
|
||
|
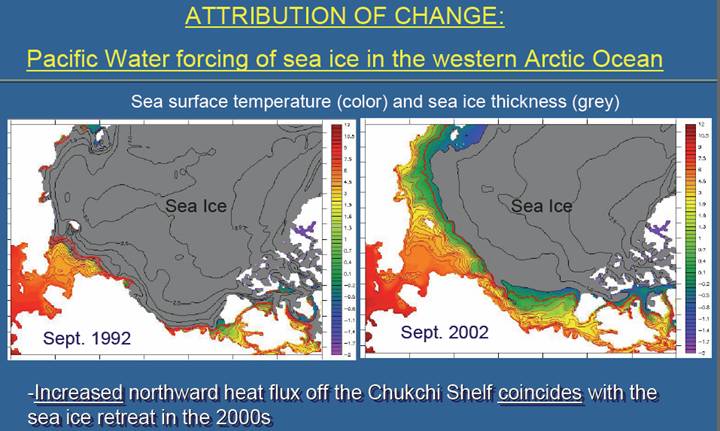
Attribution: Influx of Pacific Ocean Water Into Arctic
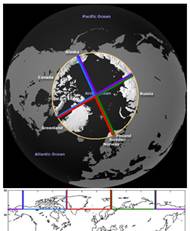
The following figure is from [http://www.ametsoc.org/atmospolicy/documents/May032006_Dr.WieslawMaslowski.pdf]
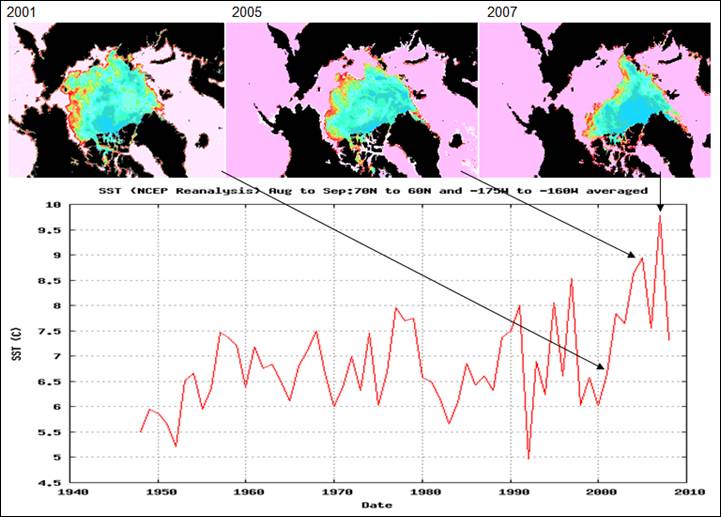
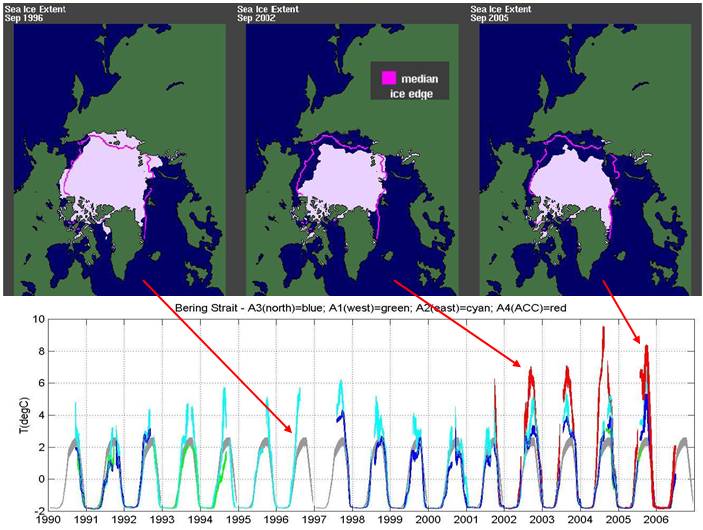
The following figure compares sea ice maps for September (from http://polar.ncep.noaa.gov/seaice/analysis/nh/ - ice figure comparison at http://www.abmcdonald.freeserve.co.uk/north.htm) with the Bering Strait August-September average sea surface temperatures (from http://www.cdc.noaa.gov/cgi-bin/data/timeseries/timeseries1.pl).
September Sea Ice 2001, 2005, 2007 and Sea Surface Temperatures for Bering Strait Area
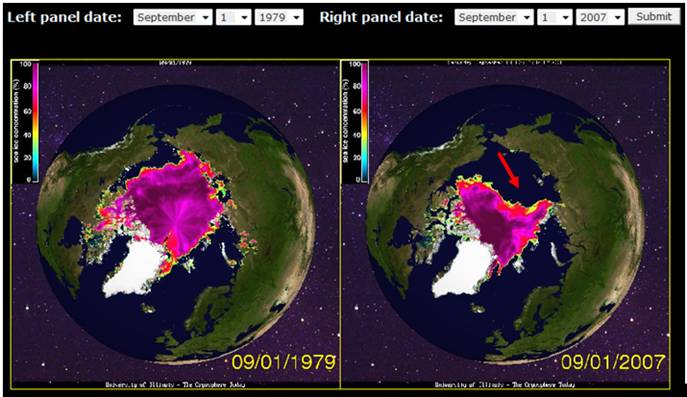
The University of Illinois Polar Research Group provides sea ice comparisons for any date [http://igloo.atmos.uiuc.edu/cgi-bin/test/print.sh]. The image below compares Sept 1 2007 with Sept 1 1979 (the oldest Sept 1 image available). The decrease in ice is all in the Chukchi Sea / East Siberian Sea area, as indicated by the arrow.
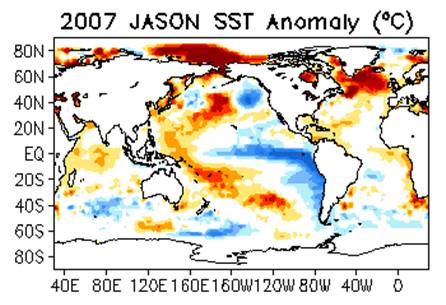
The following figure shows the JASON (satellite) based global sea surface temperature anomaly for 2007. The Chukchi Sea are had the largest anomaly in the world.
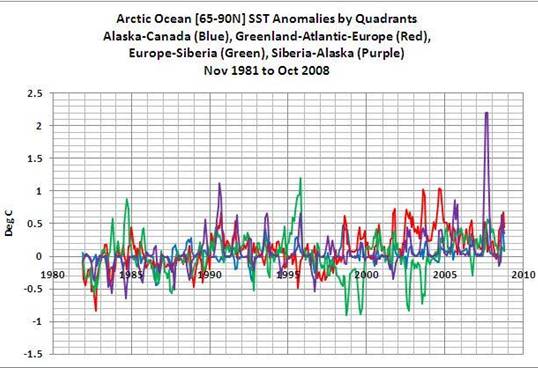
The following figure shows Arctic Ocean sea surface temperature anomalies for satellite data for 4 Arctic Ocean quadrants for 1982 to 2008. (Data from NOAA Satellite and Information Service [http://nomads.ncdc.noaa.gov/#climatencdc] plotted by Bob Tisdale [http://bobtisdale.blogspot.com/2008/11/2007-spike-in-arctic-ocean-sst.html]) This shows that the anomalous 2007 temperature spike occurred in the area of the Chukchi Sea.
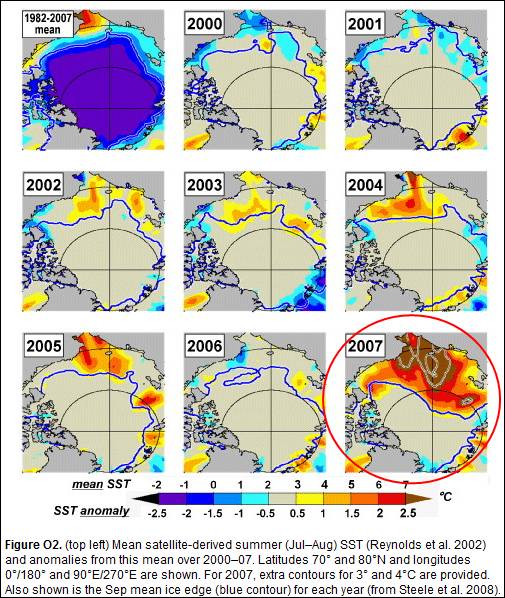
The following figure shows the summer sea surface temperature anomalies for 2000 - 2007 [http://www.arctic.noaa.gov/reportcard/ocean.html]. The 2007 temperature increase in the Chukchi Sea was extraordinary in 2007.
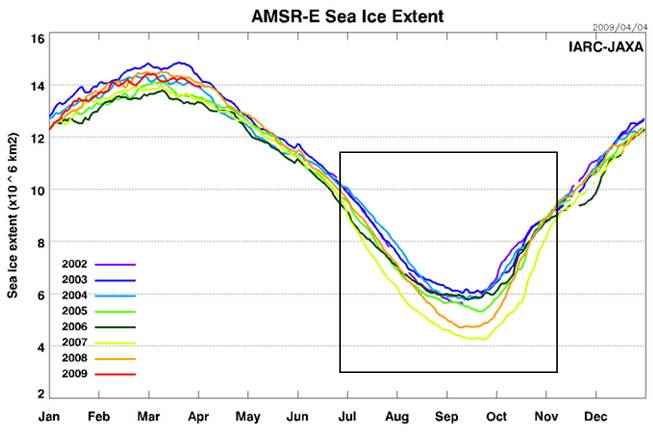
The following figure shows the Arctic sea ice extent [http://www.ijis.iarc.uaf.edu/seaice/extent/AMSRE_Sea_Ice_Extent.png]. It shows the extent throughout the year with plots for 2002 through 2009. The 2007 sea ice extent is the lime-green line. The extent was in the normal range for the 2000s until late June when the rapid ice decrease started and accelerated through July, reaching its lowest extent in September.
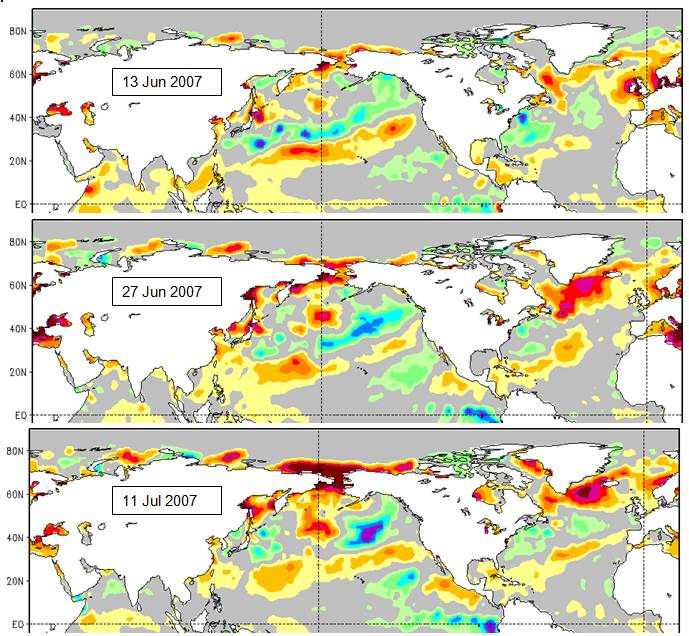
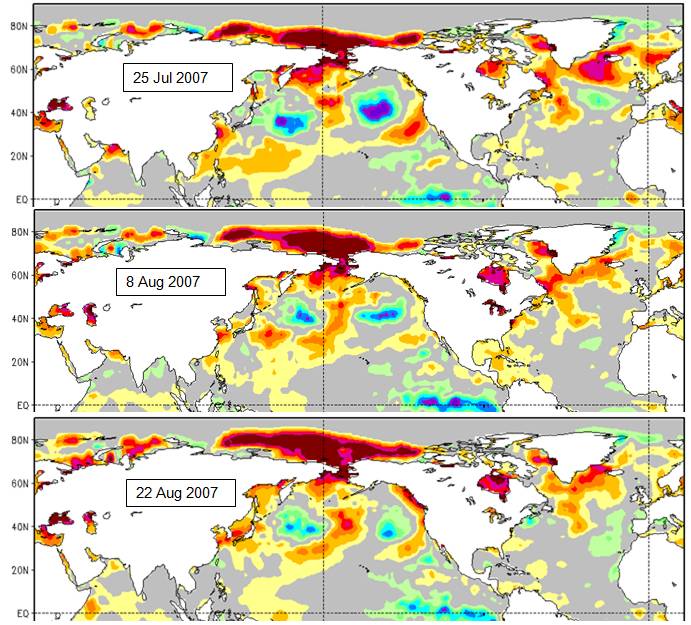
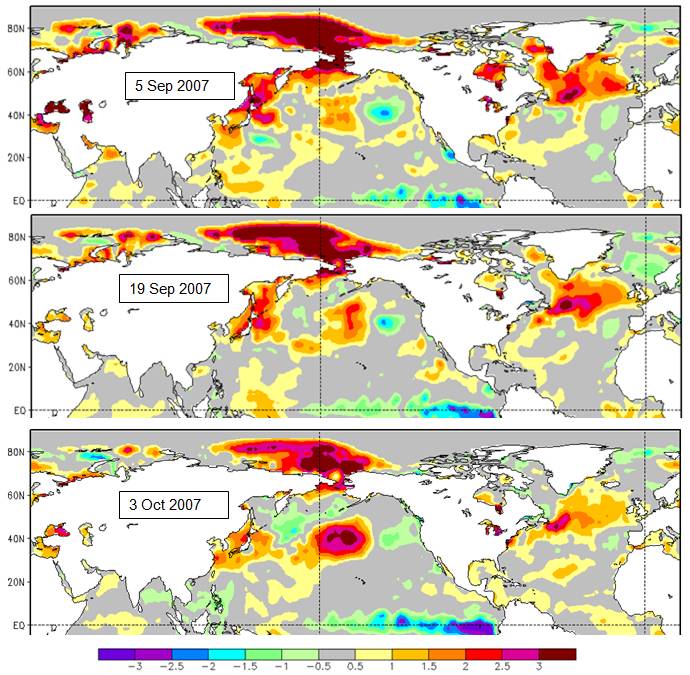
The following series of figures shows the progression of sea surface temperatures for June through early October 2007 (figures are 2-week interval sequence from [http://www.ncdc.noaa.gov/oa/climate/research/sst/weekly-sst.php]).
The following figure combines sea ice plots from [http://www.ametsoc.org/atmospolicy/documents/May032006_Dr.WieslawMaslowski.pdf] with a plot of Bering Strait temperature from [www.udel.edu/CATS/reports/OSU2006/RebeccaWoodgateBering.ppt] That report states in the conclusions: “The increased heat fluxes via Pacific/Atlantic Water explain the lack of correlation between sea ice and atmospheric forcing in the 2000s”. The 2007 anomaly is part of this trend of warm inflow from the Pacific to the Chukchi Sea.
|
||
|
Arctic Dipole / Clouds
A study published in 2009 (Wang, Zhang, Watanabe, Ikeda, Mizobata, Walsh, Bai and Wu: “Is the Dipole Anomaly a major driver to record lows in Arctic summer sea ice extent?”, Geophysical Research Letters, Vol 36, 2009 [ftp://ftp.glerl.noaa.gov/wang/Related_Papers/Wang_paper63_2009_GRL.pdf]) states: “Recent record lows of Arctic summer sea ice extent are found to be triggered by the Arctic atmospheric Dipole Anomaly (DA) pattern. This local, second–leading mode of sea–level pressure (SLP) anomaly in the Arctic produced a strong meridional wind anomaly that drove more sea ice out of the Arctic Ocean from the western to the eastern Arctic into the northern Atlantic during the summers of 1995, 1999, 2002, 2005, and 2007. In the 2007 summer, the DA also enhanced anomalous oceanic heat flux into the Arctic Ocean via Bering Strait, which accelerated bottom and lateral melting of sea ice and amplified the ice–albedo feedback.”
The following figures show: Left: winter (DJF) sea-level pressure (SLP) averaged over the period 1900-2001. [http://www.climate4you.com/NAOandAO.htm] Right: SLP anomaly pattern for Jan–May 2007 [http://www.arctic.noaa.gov/reportcard/atmosphere.html] (The right-hand figure was rotated 180 degrees from the original to give the same global orientation as the left figure). An anomalous high pressure over the Bering Sea moved farther north as the summer progressed.
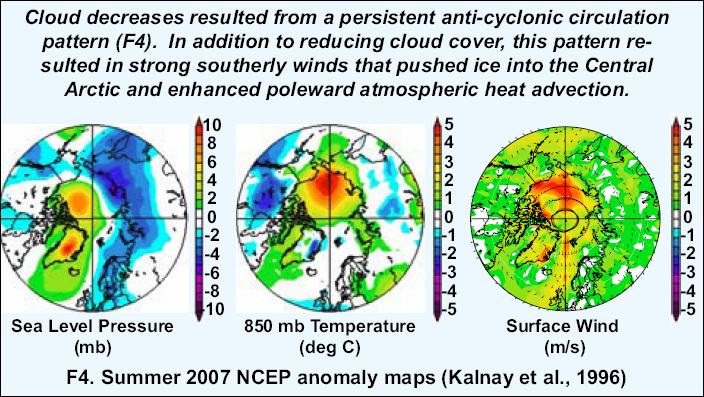
The following figure shows SLP, 850 mb (approximately 5000 ft altitude) temperature and surface winds for summer 2007 [http://www.arm.gov/publications/proceedings/conf18/poster/P00181.pdf].
The following figure shows cloud and radiative flux differences for 2007 compared to 2006 (western Arctic is the Chukchi Sea / Beaufort Sea area) [http://www.cgd.ucar.edu/cms/jenkay/papers/NCAR_Kay_noextras.ppt.pdf].
|
||
|
Ice Piling
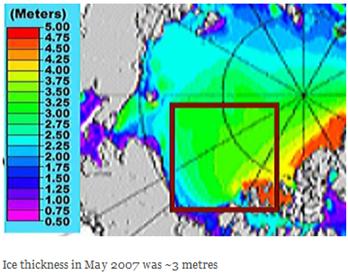
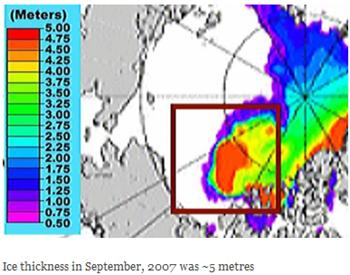
The winds pushing Pacific water into the Arctic also caused the ice to pile up thus increasing its thickness in the Beaufort Sea. The following figures show the ice thickness in May (left) and September (right) 2007. [http://wattsupwiththat.com/2010/05/28/the-great-2007-ice-crunch/#more-19963]
|
||
|
|