Global Warming Science - www.appinsys.com/GlobalWarming
Alaska
[last update: 2010/07/04]
|
Temperatures
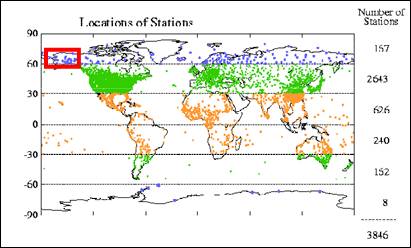
There are very few stations in Alaska with long-term data.
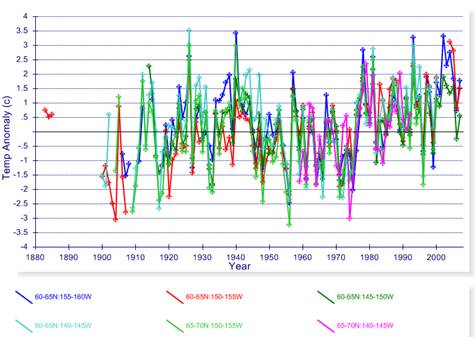
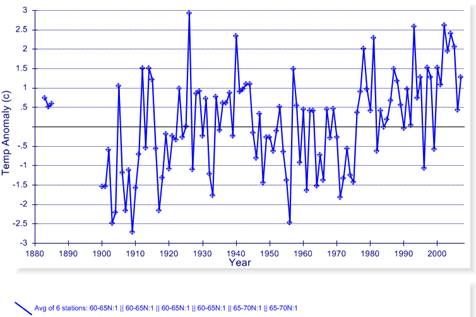
The following figures show average temperature anomalies for 1880 – 2007 for the 5x5 degree gridded data from the Hadley Climatic Research Unit database used by the IPCC. The top figure shows the average annual temperature anomalies for the 6 grids with data; the next figure shows the average of these 6 grids. (Data plotted at http://www.appinsys.com/GlobalWarming/climate.aspx)
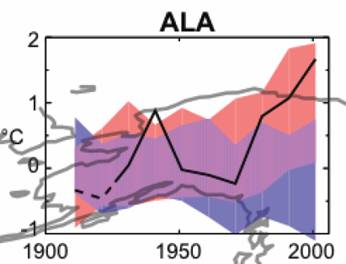
The following figures show average the IPCC model plot (from AR4 Fig 9.12) (pink= models with anthropogenic CO2, blue= models without anthropogenic CO2, black= observed smoothed mean). The right-hand figure then has the average annual temperature data from above superimposed on the models plot. Alaska exhibits extreme natural variance in the temperature data. This results in the with CO2 / without CO2 model bands having significant overlap. .
In the 1930’s there were 15 stations with data; in the 1950’s it peaked at 32 stations; in the 1990’s there were 10 stations; in 2007 it is down to 3 stations. There are only two stations in the GISS database that have continuous long-term data starting prior to 1930 and continuing to the present Anchorage and Fairbanks:
The Fairbanks/Int temperature graph shown above (with data starting in 1929) seems to display a warming trend. However if it is compared with another station in Fairbanks that starts in 1904 but ends in 1990, a different trend is observed due to warmer temperatures in the early 1920’s. The following figure compares the two stations (with University Exp Stn displayed in blue and Fairbanks/Int displayed in red).
There are a few stations in the GISS database that have long-term data ending in the 1990’s or early 2000’s:
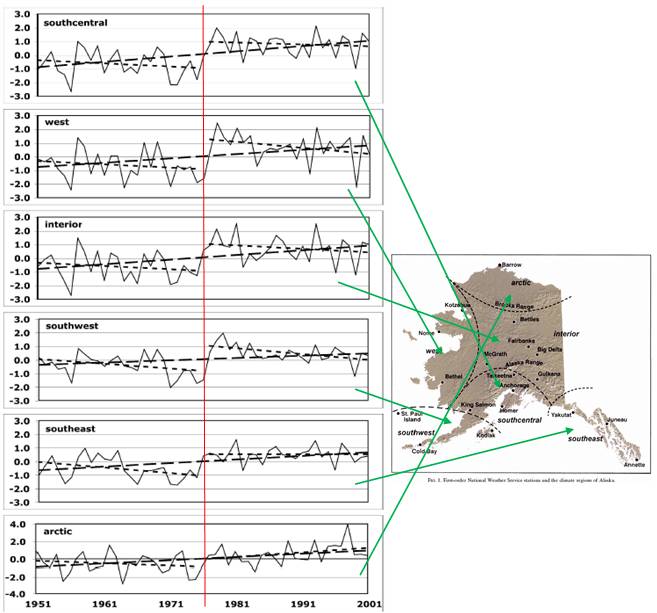
The following figure is from a study published in 2005 (Brian Hartmann and Gerd Wendler: “The Significance of the 1976 Pacific Climate Shift in the Climatology of Alaska”, Journal of Climate, Vol.18, 2005) [http://climate.gi.alaska.edu/ResearchProjects/Hartmann%20and%20Wendler%202005.pdf]. The figure shows temperature trends for each climate region in Alaska, including linear trends for the entire period and for the two periods separated by 1976. Linear trends through the whole period provide a very misleading interpretation. Except for the Arctic region, all of the warming in Alaska occurred in the two-year period of – 1976 - 1978. The temperature trend was decreasing prior to the 1976 climate shift and since then has also not been warming.
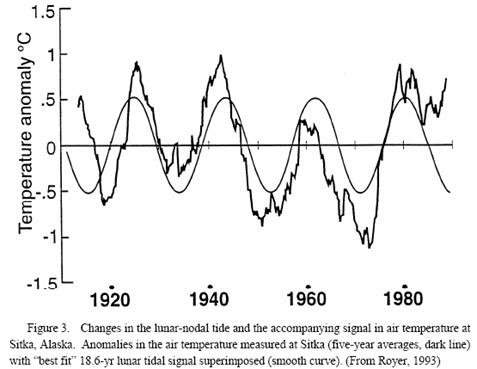
The following figure compares the Sitka air temperatures with the lunar-nodal tide cycle [http://www.pmel.noaa.gov/np/pages/inter-agency/schu_shift.pdf]
|
|
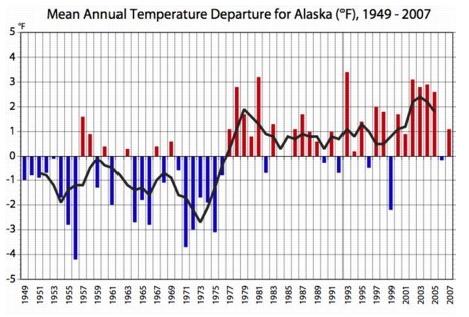
Pacific Decadal Oscillation (PDO) / Fisheries The following figure is from the Alaska Climate Research Center and shows the “stepwise shift appearing in the temperature data in 1976 corresponds to a phase shift of the Pacific Decadal Oscillation from a negative phase to a positive phase” [http://climate.gi.alaska.edu/ClimTrends/Change/TempChange.html]. (See www.appinsys.com/GlobalWarming/PDO_AMO.htm for more information on the PDO)
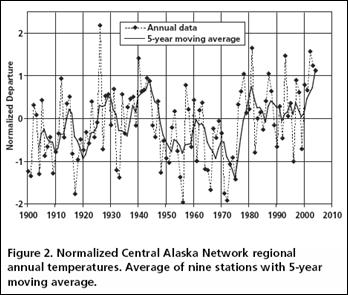
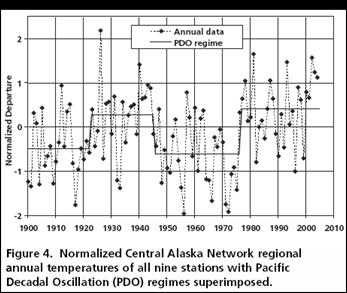
The Central Alaska Inventory and Monitoring Network monitors the climate in the National Parks of Alaska. They provide the first two figures shown below. The report states: “The strongest and most consistent of the observed correlations for the CAKN analysis, as in the other studies mentioned above, is between annual, and especially winter, temperature and the PDO” [http://www.nps.gov/akso/AKParkScience/symposium2006/sousanes.pdf]. They also make the statement: “the net change in annual temperatures since 1920 is less that 0.5 degree F. These results highlight the importance of defining the period of record when analyzing long-term trends. If a 30-year record were analyzed it would show significant warming in the region, but with 80 years of data the large decadal variability of the climate becomes more apparent.”
The following figure superimposes the Central Alaska temperature data from above (changed to green) on the PDO data.
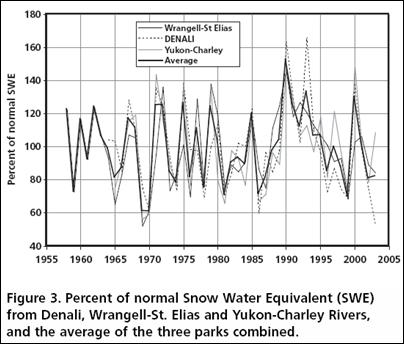
The same study cited above provides the following figure in terms of snowfall. Apparently global warming hasn’t reduced the snowfall below the normal range.
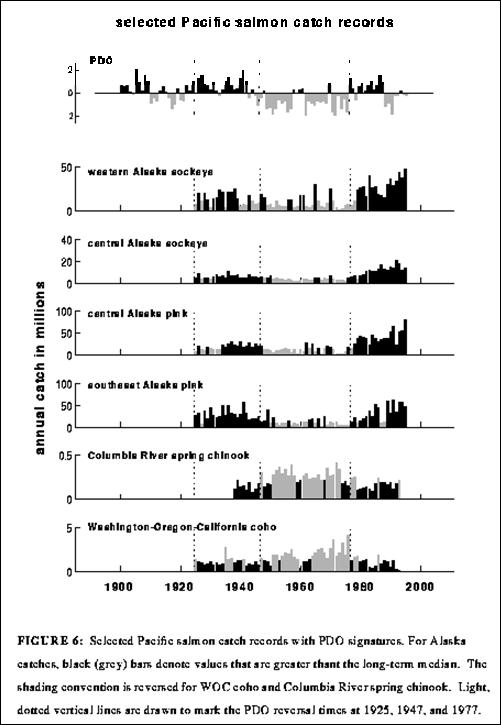
A study of Alaskan Chinook Salmon catch also showed a correlation to the PDO. The following figure shows Chinook salmon catch (purple bars) along with the 5-year running mean of the PDO index (black line) [http://www.columbia.edu/~kjh2103/Salmon-omics-PDO.pdf]
A Fish & Wildlife Service report on the Kenai National Wildlife Refuge states: “The PDO turned strongly warm in 1977, and it had a big effect on Alaska and the Pacific Northwest. After 1977 warmer ocean temperatures brought increased salmon runs and more halibut to Alaska, but the shrimp fishery was hammered because shrimp like colder water.” [http://kenai.fws.gov/overview/notebook/2008/august/29august2008.htm]
The following figure is from a study of the impacts of the PDO on salmon production. It shows a positive correlation with the PDO for Alaskan salmon: “A remarkable characteristic of Alaskan salmon abundance over the past half-century has been the large fluctuations at interdecadal time scales which resemble those of the PDO” [http://www.atmos.washington.edu/~mantua/REPORTS/PDO/pdo_paper.html]
|
|
Glaciers
A 2007 paper by Syun-Ichi Akasofu at the International Arctic Research Center (University of Alaska Fairbanks) [http://www.iarc.uaf.edu/highlights/2007/akasofu_3_07/index.php ] states: “only a fraction of the present warming trend may be attributed to the greenhouse effect resulting from human activities. This conclusion is contrary to the IPCC (2007) Report, which states that “most” of the present warming is due to the greenhouse effect. One possible cause of the linear increase may be that the Earth is still recovering from the Little Ice Age. It is urgent that natural changes be correctly identified and removed accurately from the presently on-going changes in order to find the contribution of the greenhouse effect… The fact that an almost linear change has been progressing, without a distinct change of slope, from as early as 1800 or even earlier (about 1660, even before the Industrial Revolution), suggests that the linear change is natural change.”
The authors also analyzed the trends of melting glaciers and state that, glaciers: “have been receding from the time of the earliest records... There are a large number of similar records from the European Alps and elsewhere (Grove, 1982). Therefore, it can be assumed that many glaciers advanced during the Little Ice Age and have been receding since then. Thus, the retreat is not something that happened only in recent years.”
The following figure shows the Glacier Bay glacier retreat from 1790’s to 1990’s (from the above Akasofu paper).
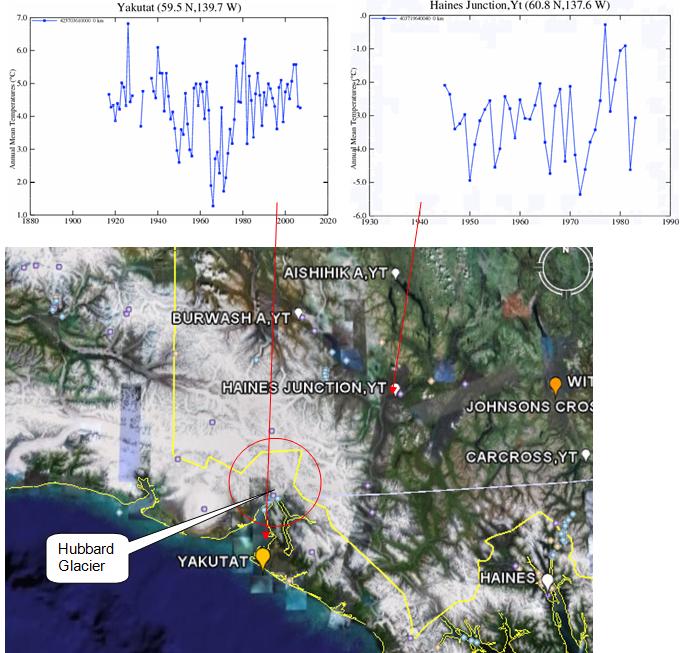
However, not all glaciers in Alaska are retreating. The Hubbard Glacier near Yakutat Alaska “has been thickening and advancing toward the Gulf of Alaska since it was first mapped by the International Boundary Commission in 1895” [http://ak.water.usgs.gov/glaciology/hubbard/] “Hubbard Glacier is the largest of eight calving glaciers in Alaska that are currently increasing in total mass and advancing.”
The following figure shows the advance of the glacier over the last 100 years [http://pubs.usgs.gov/fs/fs-001-03/].
A study by Trabant et al (“The Slow Advance of a Calving Glacier: Hubbard Glacier, Alaska”, Annals of Geology, Vol 36, 2003) states: “the lower regions of the glacier have thickened by as much as 83 m in the last 41 years, while the entire glacier increased in volume by 14.1 cubic km. Ice speeds are generally decreasing near the calving face.”
The following figures show the monthly temperature anomalies and precipitation for Yakutat – the closest temperature station to the Hubbard Glacier.
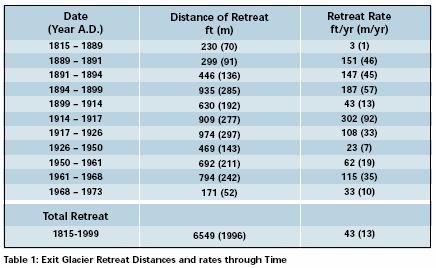
Exit Glacier, Kenai Fjords National Park, Alaska
“Exit Glacier is one of 38 glaciers that flow out from the Harding Icefield. During the early nineteenth century, the glacier almost reached the Resurrection River, approximately 1.25 miles (2 km) below its present location. … The Little Ice Age (LIA) was a time of global cooling from approximately 1350 to 1870 AD. During this time glaciers expanded in the northern regions, … With the warming trend of the 1800s, Exit Glacier began to retreat from its 1815 maximum.” [http://www.nps.gov/kefj/naturescience/upload/The%20Retreat%20of%20Exit%20Glacier.pdf]
The following table shows the glacier retreat rate (from the above reference).
|
|
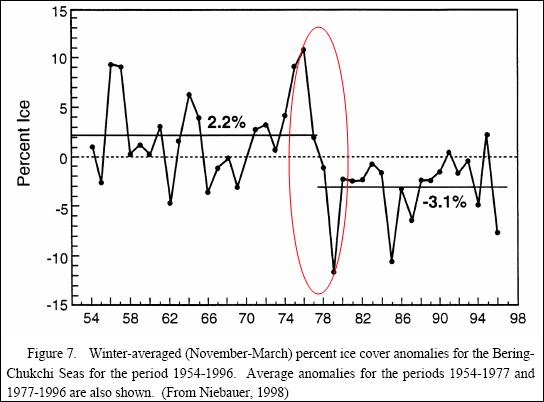
Sea Ice
Niebauer, H. J. (1998), “Variability in Bering Sea ice cover as affected by a regime shift in the North Pacific in the period 1947–1996”, J. Geophys. Res., 103 [http://www.agu.org/pubs/crossref/1998/98JC02499.shtml] “In the late 1970s, a “regime shift” or “step” occurred in the climate of the North Pacific, causing, among many other effects, a 5% reduction in the ice cover in the eastern Bering Sea as well as shifts in the position of the Aleutian low. … Since the regime shift, El Niño conditions are about 3 times more prevalent. In recent work [e.g., Mantua et al., 1997; Minobe, 1997] there is evidence that this regime shift is the latest in a series of climate shifts going back to at least the late 1800s and may be due to a 50- to 70-year oscillation in a North Pacific atmospheric-ocean coupled system.”
The following figure shows the effect of the 1976-77 pacific climate shift on the Fairbanks temperature stations shown previously (University Exp Stn - blue and Fairbanks/Int - red).
|
|
Sea Level
Alaskan sea levels have been steadily decreasing over the last century as shown in the following figure (sea level graphs from the UK Permanent Service for Mean Sea Level [http://www.pol.ac.uk/psmsl/]). This is mainly due to the isostatic rebound of the area since the little ice age in the 1700s. Clearly rising sea level is not a problem in Alaska.
|
|
Wildfire
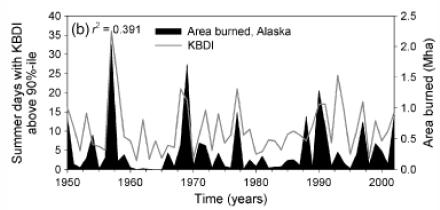
Alaskan wildfires have not increased in recent decades as shown in the following figure. [http://www.umr5059.univ-montp2.fr/IMG/pdf/49_Girardin_etal_GCB09.pdf]
|
|
|