Global Warming Science - www.appinsys.com/GlobalWarming
The Pre-Historical Temperature Record
[last update: 2010/02/15]
|
The historical record of global temperatures comes from various sources since instrumentally recorded temperatures exist for just over 100 - 150 years. For many parts of the world the instrumental measurements are sparse. The satellite data era began in 1979.
The popular global warming theory is that anthropogenic CO2 emissions have caused unprecedented global warming in the second half of the 20th century. If it the late 20th century warming can’t be shown to be unprecedented, then there is a major problem with the theory.
The pre-historical record has been derived by various researchers using different types of proxy measurements. The IPCC requires elimination of the Medieval Warm Period since many researchers believe it was as warm then.
|
||||
|
CRU Emails
An examination of the CRU emails pertaining to the Medieval Warm Period and the “unprecedented” nature of the 20th century global warming is provided here: http://www.appinsys.com/GlobalWarming/UnprecedentedWarming.htm
|
||||
|
This document contains the following sections:
|
||||
|
|
||||
|
The Intergovernmental Panel on Climate Change (IPCC) is a United Nations based group focused on evaluating global climate change. The following figure is from their AR4 report (2007). It shows their calculated global average temperature for 1850 to 2006.
Global Temperature Anomaly for 1850 AD to 2006 AD [From IPCC Climate Change 2007 Summary for Policymakers p 6]
From the above graph it appears that the global average temperature has increased by approximately 0.8 degree over the last 150 years.
Since widespread, reliable instrumental records are available only for the last 100 – 150 years or so, climatic conditions in the more distant past are estimated by analyzing proxy evidence from other sources. Proxies include tree rings, corals, ocean and lake sediments, cave deposits, ice cores, boreholes, glaciers, and documentary evidence. Knowledge of past climates is necessary in order to put the recent climate into a broader context. Starting in the late 1990s, scientists began combining proxy evidence from many different locations in an effort to estimate surface temperature changes averaged over broad geographic regions over various time frames.
The first of these reconstructions published in 1998 and 1999 by Michael Mann, Raymond Bradley, and Malcolm Hughes, (MBH) attracted considerable attention because the authors concluded that the Northern Hemisphere was warmer during the late 20th century than at any other time during the past millennium. Controversy arose because many people interpreted this result as definitive evidence of anthropogenic causes of recent climate change, while others criticized the methodologies and data that were used.
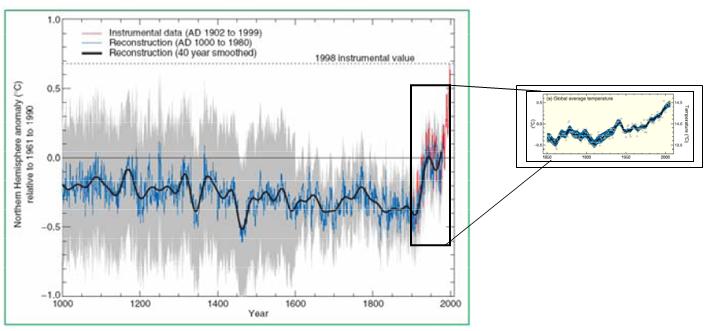
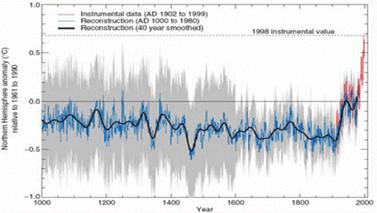
The following figure shows average northern hemisphere temperature anomalies for the last 1000 years and is known as the “hockey-stick” graph (due to its shape). The “hockey-stick” graph was eventually debunked by the National Academy of Sciences, as described below.
Northern Hemisphere Temperature Anomaly for 1000 AD to 2000 AD [From IPCC TAR Technical Summary 2001 p 29]
The above figure shows an apparent slight cooling trend for most of the last 1000 years with a definite uptrend in the last 100 years. This leads to the assumption that it has anthropogenic cause since this period is the industrial age. The gray banding in the figure indicates the levels of uncertainty in the data.
In 1998 Nature published the first Mann hockey stick paper, commonly called “MBH98.” Mann et al. followed up in 1999 with a paper in Geophysical Research Letters (“MBH99”) extending their results from AD1400 back to AD1000 (as shown the above figure). In early 2000 the IPCC released the first draft of the TAR. The hockey stick was the only paleoclimate reconstruction shown in the Summary, even though most other scientists disagree with the elimination of the Medieval Warm Period and Little Ice Age.
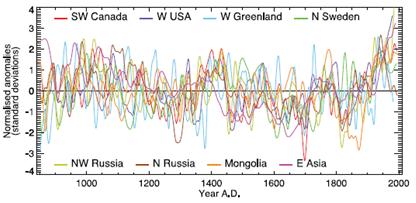
The following figure shows a similar time range as the previous figure from a different source (National Academy of Sciences) – but it’s not exactly a hockey stick.
Global and/or Northern Hemisphere Temperature Anomalies from Proxy Data for the last 1000 years [From: Surface Temperature Reconstructions for the Last 2,000 Years, Committee on Surface Temperature Reconstructions for the Last 2,000 Years, National Research Council http://dels.nas.edu/dels/rpt_briefs/Surface_Temps_final.pdf]
Although the IPCC no longer uses the “hockey-stick” graph, they have replaced it with a “spaghetti-graph” of multiple proxy studies, as shown in the following figure.
Box 6.4 Figure 1 from the IPCC 4AR (Chapter 6)
IPCC AR4 reviewer Steve McIntyre described his review of the usage of bristlecone and foxtail pines in this IPCC temperature proxy figure [http://www.climateaudit.org/?p=2245]. In his review, McIntyre criticized the IPCC for including proxies that were based on bristlecone and foxtail pines (since tree rings from these trees have been shown in various studies to exhibit no correlation with temperature). McIntyre calculated correlations for the included studies and found that some had zero correlation to temperatures at the study locations. The IPCC lead author of the section rejected the reviewer’s comment stating: “the purpose of this Figure is to illustrate in a simple fashion, the variability of numerous records that have been used in published reconstructions of large-scale temperature changes”. The figure shown above also includes the discredited MBH1999 hockey stick.
The IPCC went to considerable effort to provide evidence that the warming was unprecedented. The “hockey-stick” graph produced by Michael Mann (and used by the IPCC and Al Gore) eliminated the Medieval Warm Period and the Little Ice Age in order to exaggerate the 20th century warming. The following table compares the hockey stick used in the TAR with its replacement in the AR4.
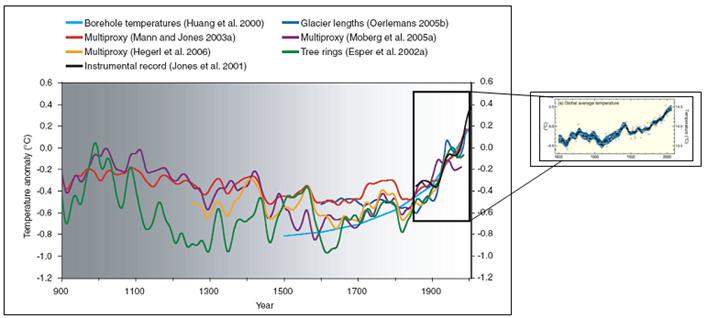
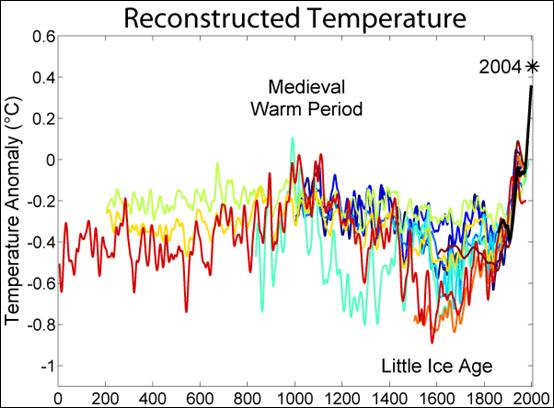
There are many reconstructions of temperature records from various proxies, many of which exhibit quite different trends. The following figure shows a comparison of 10 different published reconstructions of mean temperature changes during the last 2000 years. It is unknown which, if any, of these reconstructions is an accurate representation of climate history; however, these curves are a fair representation of the range of results appearing in the published scientific literature. Jones and Mann have made an apparently conscious attempt to eliminate the Little Ice Age from the record.
Temperature Anomalies for the Last 2000 Years [above from global warming art http://en.wikipedia.org/wiki/Image:2000_Year_Temperature_Comparison.png ]
· (dark blue 1000-1991): Jones, P.D., K.R. Briffa, T.P. Barnett, and S.F.B. Tett (1998). "High-resolution Palaeoclimatic Records for the last Millennium: Interpretation, Integration and Comparison with General Circulation Model Control-run Temperatures". The Holocene 8: 455-471 · (blue 1000-1980): Mann, M.E., R.S. Bradley, and M.K. Hughes (1999). "Northern Hemisphere Temperatures During the Past Millennium: Inferences, Uncertainties, and Limitations". Geophysical Research Letters 26 (6): 759-762. · (light blue 1000-1965): Crowley and Lowery (2000). "Northern Hemisphere Temperature Reconstruction". Ambio 29: 51-54.; Modified as published in Crowley (2000). "Causes of Climate Change Over the Past 1000 Years". Science 289: 270-277. · (lightest blue 1402-1960): Briffa, K.R., T.J. Osborn, F.H. Schweingruber, I.C. Harris, P.D. Jones, S.G. Shiyatov, and E.A. Vaganov (2001). "Low-frequency temperature variations from a northern tree-ring density network". J. Geophys. Res. 106: 2929-2941. · (light green 831-1992): Esper, J., E.R. Cook, and F.H. Schweingruber (2002). "Low-Frequency Signals in Long Tree-Ring Chronologies for Reconstructing Past Temperature Variability". Science 295 (5563): 2250-2253. · (yellow 200-1980): Mann, M.E. and P.D. Jones (2003). "Global Surface Temperatures over the Past Two Millennia". Geophysical Research Letters 30 (15): 1820. DOI:10.1029/2003GL017814 · (orange 200-1995): P.D. Jones and M.E. Mann (2004). "Climate Over Past Millennia". Reviews of Geophysics 42: RG2002. DOI:10.1029/2003RG000143 · (red-orange 1500-1980): Huang, S. (2004). "Merging Information from Different Resources for New Insights into Climate Change in the Past and Future". Geophys. Res Lett. 31: L13205. DOI:10.1029/2004GL019781 · (red 1-1979): Moberg, A., D.M. Sonechkin, K. Holmgren, N.M. Datsenko and W. Karlén (2005). "Highly variable Northern Hemisphere temperatures reconstructed from low- and high-resolution proxy data". Nature 443: 613-617. DOI:10.1038/nature03265 · (dark red 1600-1990): Oerlemans, J.H. (2005). "Extracting a Climate Signal from 169 Glacier Records". Science 308: 675-677. DOI:10.1126/science.1107046 · (black 1856-2004): Instrumental data was jointly compiled by the Climatic Research Unit and the UK Meteorological Office Hadley Centre. Global Annual Average data set TaveGL2v [2]
Ross McKitrick of the University of Guelph did an in-depth study of Michael Mann’s data used to produce the hockey stick graph. What he found was that Mann used a data analysis method that essentially forced the data sets (mostly tree-ring proxies, but also other proxies) to take the shape of strongest shapes found in any data set. Most of the data sets exhibited no trend. But those that did were weighted in an unrealistic manner. Detailed information about his analysis can be found at http://www.uoguelph.ca/~rmckitri/research/trc.html.
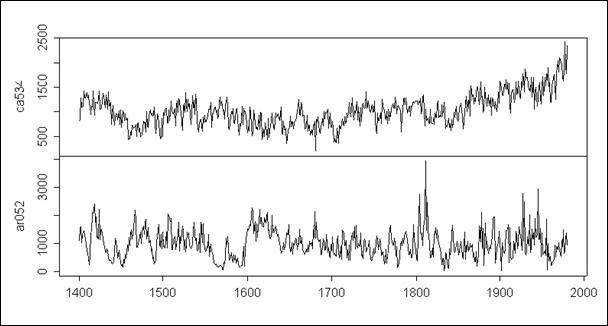
The following figure shows two of Mann’s tree-ring proxy data sets. Both series are the same length, but due to the increasing trend in the 20th century in the top panel, Mann’s algorithm gives that series 390 times the weight of the bottom series.
Two tree ring chronologies from the MBH98 data set. Top: Sheep Mountain, CA, USA. Bottom: Mayberry Slough
McKitrick found many errors in Mann’s data analysis methods, which have been published [McIntyre, Stephen and Ross McKitrick (2005a) “The M&M Critique of the MBH98 Northern Hemisphere Climate Index: Update and Implications.” Energy and Environment 16(1) pp. 69-100; (2005b) “Hockey Sticks, Principal Components and Spurious Significance” Geophysical Research Letters Vol. 32, No. 3, L03710 10.1029/2004GL021750 12 February 2005. See www.climateaudit.org.]
The following figure shows one of the results of McKitrick’s analyses where invalid data were removed. The hockey stick (dashed line) ends up showing the occurrence of the Medieval Warm Period (something that Mann denies occurred).
Dashed line: MBH98 proxy-based Northern Hemisphere temperature index reconstruction. Solid line: Series resulting from using corrected PCs (retaining 5 PCs in the North America network), removing Gaspé extrapolation and applying CO2 fertilization adjustment to full length of bristlecone pine series
In 2006 a National Academy of Sciences (NAS) panel investigated the hockey stick graph used by the (IPCC) to promote the idea that humans are causing rapid and unprecedented global warming. McKitrick had argued that the hockey stick relied for its shape on the inclusion of a set of invalid proxy data (“strip-bark” records). If they are removed, the conclusion that the 20th century is unusually warm compared to the pre-1450 interval is reversed. Hence the conclusion of unique late 20th century warmth does not hold up under minor variations in data or methods. The NAS panel agreed, saying Mann’s results are “strongly dependent” on the strip-bark data (pp. 106-107), and they went further, warning that strip-bark data should not be used in this type of research (p. 50).
McKitrick’s analysis was further backed up by a study by Wegman etc al [Edward J. Wegman, George Mason University, David W. Scott, Rice University, and Yasmin H. Said, The Johns Hopkins University.], which verified that Mann’s hockey-stick graph was invalid.
As a result the “hockey-stick” graph has been deemed invalid and the IPCC no longer includes it in its reports. For more details on this see: www.climateaudit.org/pdf/ohio.pdf
“Hide the Decline”
In 2009 the University of East Anglia Climatic Research Unit (CRU) emails were released (by an insider or hacker) and are available at: http://www.eastangliaemails.com/
One of the most popular emails referred to “hide the decline”. This refers to an email from Phil Jones (in charge of the climate data at the CRU) to Ray Bradley, Michael Mann and Malcolm Hughes (Nov.1999) [http://www.eastangliaemails.com/emails.php?eid=154&filename=942777075.txt] :
“I've
just completed Mike's Nature trick of adding in the real temps
This refers to a divergence problem: The MBH proxy temperature data sets used to create the hockey stick start showing a decline in temperatures at the end of the data set in the 1980s (when the global average was increasing). They grafted the instrument record onto the data set to show an increase, when in fact the proxies were showing a decrease. The decline being hidden is in the proxy data in the 1980s when the data should have shown an increase if it actually matched the instrumental record. This brings into question the validity of the entire proxy record used by MBH when it doesn’t match the instrumental record in the 1980s.
|
||||
|
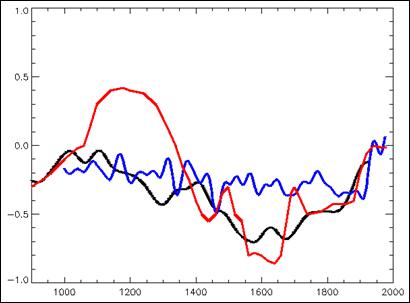
The Medieval Warm Period (MWP) was previously accepted as a warm period that occurred in the time frame of about 1000-1400 AD. That is, until the advent of IPCC and Mann’s hockey stick – now many claim the MWP never happened, or that it was a minimal regional event. But most scientists do not accept the recent IPCC-inspired rejection of the MWP, which was based on Mann’s flawed study.
Red Line – 1980’s Accepted Temperature Trend, Blue Line – IPCC 2001 Hockey Stick, Black Line – Moberg et. al
The IPCC 1990 report showed the temperature graph of the red line in the above figure, which indicates the MWP and the Little Ice Age (LIA). But in the IPCC 1995 report, the only pre-instrumental temperature trend figure included uses a northern hemisphere temperature reconstruction, starting in 1400 -thus leaving out the MWP. The IPCC 2001 report (TAR) shows temperature reconstructions starting from 1000 AD from Mann, Jones and Briffa and prominently displays the hockey-stick graph as shown previously. The TAR states: “the posited Medieval Warm Period appears to have been less distinct, more moderate in amplitude… The Northern Hemisphere mean temperature estimates of Jones et al. (1998), Mann et al. (1999), and Crowley and Lowery (2000) show temperatures from the 11th to 14th centuries to be about 0.2°C warmer than those from the 15th to 19th centuries, but rather below mid-20th century temperatures. Thus current evidence does not support globally synchronous periods of anomalous cold or warmth over this timeframe, and the conventional terms of "Little Ice Age" and "Medieval Warm Period" appear to have limited utility in describing trends in hemispheric or global mean temperature changes in past centuries”.
This IPCC statement is at odds with the findings of other scientists. For example, research at the Harvard-Smithsonian Center for Astrophysics report on a recent paper using proxies, which verifies the occurrence of the MWP: [http://cfa-www.harvard.edu/press/pr0310.html] “A review of more than 200 climate studies led by researchers at the Harvard-Smithsonian Center for Astrophysics has determined that the 20th century is neither the warmest century nor the century with the most extreme weather of the past 1000 years. The review also confirmed that the Medieval Warm Period of 800 to 1300 A.D. and the Little Ice Age of 1300 to 1900 A.D. were worldwide phenomena not limited to the European and North American continents. While 20th century temperatures are much higher than in the Little Ice Age period, many parts of the world show the medieval warmth to be greater than that of the 20th century.”
Wikipedia also had a campaign to eliminate the MWP – see: http://network.nationalpost.com/np/blogs/fullcomment/archive/2009/12/18/370719.aspx
The University of Southern California course material on climate change in the last millennium [http://earth.usc.edu/geol150/evolution/lastmillenia.html] also provides supporting evidence of the MWP and LIA (although after citing evidence from all continents they say it may be just regional existing only in the northern hemisphere).
Many studies can be found exhibiting the MWP. One example is shown in the following figure. [http://www.wsl.ch/staff/jan.esper/publications/QRS_Cook_2004.pdf] One of the authors of the study said "The Medieval Warm Period is in some sense comparable up to 1990 in the 20th century," said Cook. "But that does not say that the 20th century hasn't been perturbed by greenhouse gases. The real challenge is to factor out the natural variability from" manmade causes of global warming.” [http://www.usatoday.com/news/science/climate/2002-02-03-tree-rings.htm]
Temperature Trend Exhibiting MWP Around Year 1000
One of the most recent multi-proxy reconstructions was published in 2005 by Moberg et al (Highly variable Northern Hemisphere temperatures reconstructed from low- and high-resolution proxy data Nature, Vol. 433, No. 7026, pp. 613 - 617, 10 February 2005 -- Anders Moberg, Dmitry M. Sonechkin, Karin Holmgren, Nina M. Datsenko & Wibjörn Karlén) (This is the black line shown two figures previously) [http://www.ncdc.noaa.gov/paleo/pubs/moberg2005/moberg2005.html] and [http://stephenschneider.stanford.edu/Publications/PDF_Papers/MobergEtAl2005.pdf] Their paper states “These reconstructions have mainly used tree-ring data and other data sets of annual to decadal resolution. Lake and ocean sediments have a lower time resolution, but provide climate information at multicentennial timescales that may not be captured by tree-ring data. Here we reconstruct Northern Hemisphere temperatures for the past 2,000 years by combining low-resolution proxies with tree-ring data, using a wavelet transform technique to achieve timescale-dependent processing of the data. Our reconstruction shows larger multicentennial variability than most previous multi-proxy reconstructions, but agrees well with temperatures reconstructed from borehole measurements and with temperatures obtained with a general circulation model. According to our reconstruction, high temperatures - similar to those observed in the twentieth century before 1990- occurred around AD 1000 to 1100, and minimum temperatures that are about 0.7K below the average of 1961-90 occurred around AD 1600. This large natural variability in the past suggests an important role of natural multicentennial variability that is likely to continue… The main implication of our study, however, is that natural multicentennial climate variability may be larger than commonly thought, and that much of this variability could result from a response to natural changes in radiative forcings.”
The following figure is from their paper. The MJ line in a) is the Mann – Jones multi-proxy study while the MBH line in d) is the Mann et al proxy study (the hockey stick) – further evidence of how Mann’s hockey stick does not match reality.
Moberg 2005 Multi-Proxy Temperature Reconstruction (2000 Years)
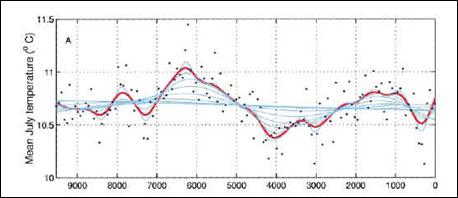
One of the proxies included in Moberg et al (above) is the July temperatures at Lake Tsuolbmajavri (Finland) shown in the following figure, based on diatoms in lake sediments.
July temperatures at Lake Tsuolbmajavri (years before present)
Although the IPCC denies the existence of the MWP and LIA as global events, many studies exist from around the world verifying the events. (The fact that the current warming varies significantly around the world seems irrelevant to them – they want to deny it to justify their hockey stick). A few examples:
·
“The Little Ice Age and Medieval
Warm Period in the Sargasso Sea” (Science
29 November 1996:
· “Was the Medieval Warm Period Global?” (Science 23 February 2001: Vol. 291. no. 5508, pp. 1497 - 1499) by Wallace S. Broecker (Lamont-Doherty Earth Observatory, Columbia University) [http://www.sciencemag.org/cgi/content/summary/291/5508/1497] summary states: “During the Medieval Warm Period (800 to 1200 A.D.), the Vikings colonized Greenland. In his Perspective, Broeker discusses whether this warm period was global or regional in extent. He argues that it is the last in a long series of climate fluctuations in the North Atlantic, that it was likely global, and that the present warming should be attributed in part to such an oscillation, upon which the warming due to greenhouse gases is superimposed.”
· “Little Ice Age and Medieval Warm Periods in Eastern China as Read from the Speleothem Records” (American Geophysical Union, 2002) by H. Li and T. Ku (University of Southern California, Department of Earth Sciences) [http://adsabs.harvard.edu/abs/2002AGUFMPP71C..09L], which states “The long-term climatic pace has often been interrupted by short-term abrupt changes. The Little Ice Age and Medieval Warm Period represent the two most important such changes over the last two millennia. Largely due to a dearth of high-resolution climatic records, our knowledge on the spatial extent, duration, and moisture characteristics of these two events is incomplete, and this has hampered our understanding of the driving force causing them as well as the recent global warming trend. … The records show that in eastern China, the Medieval Warm Period started around 1000 AD and lasted until 1500 AD. A brief cooling during this warm interval occurred around 1150 AD. The Little Ice Age in China started at around 1500 AD and ended in the mid-1800s.”
The following figure shows sunspot number as well as global temperatures derived from 10Be and 14C proxies – showing the Medieval Warm Period and Little Ice Age [http://icecap.us/images/uploads/ssless_days.pdf]
Dr. David Deming (University of Oklahoma, College of Earth and Energy) said in his testimony to congress [http://epw.senate.gov/hearing_statements.cfm?id=266543] “I had another interesting experience around the time my paper in Science was published. I received an astonishing email from a major researcher in the area of climate change. He said, "We have to get rid of the Medieval Warm Period.” The existence of the MWP had been recognized in the scientific literature for decades. But now it was a major embarrassment to those maintaining that the 20th century warming was truly anomalous.”
The following figure is from Loehle, C., and J.H. McCulloch. 2008: “Correction to: A 2000-year global temperature reconstruction based on non-treering proxies”, Energy & Environment 19(1) [http://www.ncasi.org/publications/detail.aspx?id=3025] “In this study, eighteen 2000-year-long series were obtained that were not based on tree ring data. Data in each series were smoothed with a 30-year running mean. … The mean series shows the Medieval Warm Period (MWP) and Little Ice Age (LIA) quite clearly, with the MWP being approximately 0.3°C warmer than 20th century values at these eighteen sites.”
The pro-AGW alarmists have created a red-herring from the MWP issue: They say that the MWP was not global and therefore even if it was warmer than the 1970 – 1990s warming, it doesn’t count because it wasn’t global. See: for more information.
|
||||
|
Long-Term Data (Paleoclimatology)
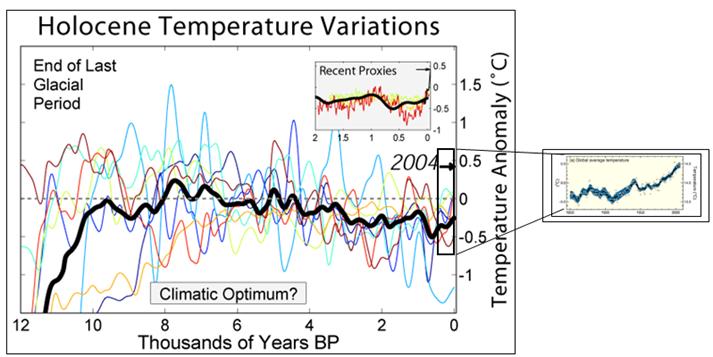
The following figure shows eight records of temperature variability on multi-centennial scales throughout the Holocene period (period since the last ice age), as well as an average of these (thick dark line). The records are plotted with respect to the mid 20th century average temperatures, and the global average temperature in 2004 is indicated. This figure can not resolve temperature fluctuations finer than approximately 300 years. The inset plot compares the most recent two millennium of the average to other high resolution reconstructions of this period.
Temperature Anomalies for the Last 12000 Years [from global warming art http://en.wikipedia.org/wiki/Image:2000_Year_Temperature_Comparison.png]
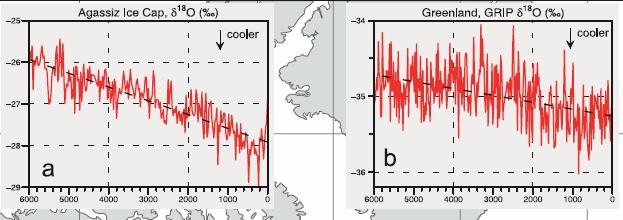
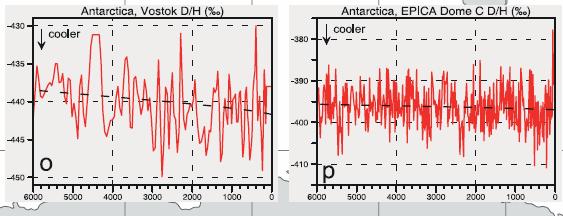
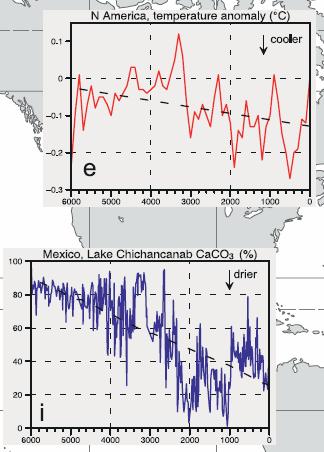
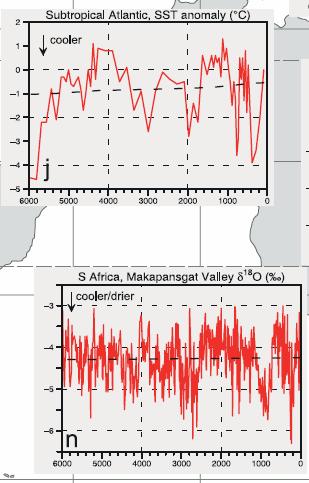
The following figures are from Wanner et al “Mid- to Late Holocene climate change: an overview” Quaternary Science Reviews, 2008 [http://www.up.ethz.ch/publications/documents/Wanner_H._et_al._08] showing various climate reconstructions for the past 6000 years.
Very Long Term
The following figure shows the temperature and CO2 information derived from the Vostok ice cores. In January 1998, the collaborative ice-drilling project between Russia, the United States, and France at the Russian Vostok station in East Antarctica yielded the deepest ice core ever recovered, reaching a depth of 3,623 m. This shows the high correlation between CO2 and temperatures.
Temperature and CO2 For The Past 400,000 Years from Vostok Ice Cores [From: UNEP/GRID-Arendal. Temperature and CO2 concentration in the atmosphere over the past 400 000 years. UNEP/GRID-Arendal Maps and Graphics Library. 2000 http://maps.grida.no/go/graphic/temperature_and_co2_concentration_in_the_atmosphere_over_the_past_400_000_years.]
Although Al Gore claimed in his movie that this figure demonstrates that CO2 drives the climate, he got it backwards. The IPCC, in the AR4 Scientific Basis report, Part 6, p444 (May 2007), makes the following statement: “Variations in CO2 over the last 420 kyr broadly followed Antarctic temperature, typically by several centuries to a millennium” [http://ipcc-wg1.ucar.edu/wg1/Report/AR4WG1_Print_Ch06.pdf]
Many scientific studies have shown that CO2 increase follows temperature increase in the pre-historical records. A few examples:
The following figure shows temperature reconstruction for five and a half million years constructed by combining measurements from 57 globally distributed deep-sea sediment cores (Lisiecki, L. E., and M. E. Raymo (2005), A Pliocene-Pleistocene stack of 57 globally distributed benthic δ18O records, Paleoceanography). Labels at the upper left indicate regions where 100 kyr and 41 kyr cyclicity is observed. These periodicities match periodic changes in Earth's orbital. This image is from: [http://en.wikipedia.org/wiki/Image:Five_Myr_Climate_Change.png ]
Temperature for the Past 5.5 Million Years from Sediment Cores
The pre-historical record shows a general cooling trend over millions of years with the last million years exhibiting a distinct wide swing in temperature approximately every 100,000 years. Recent global averages are in a range similar to the temperatures of the Medieval Warm Period. Part 2 of this Global Warming Summary document discusses the Medieval Warm Period in greater detail.
It is important to remember that the earth’s climate has always changed, and that it is still warming from the last advance of the ice age. The Wisconsin glaciation (shown in the figure below) was the last major advance, ending about 10,000 years ago.
This is important to remember for the following reasons:
“Our modern climate represents a very short, warm period between glacial advances.” [http://www.museum.state.il.us/exhibits/ice_ages/when_ice_ages.html]
For a good summary of ice ages and their effect on climate change see: http://www.geocraft.com/WVFossils/ice_ages.html
[http://en.wikipedia.org/wiki/Image:Northern_icesheet_hg.png]
|
||||
|
Climategate: On Nov 20, 2009 someone hacked a Hadley Climatic Research Unit (CRU) server and obtained emails between several prominent climate researchers (Mann, Jones, Briffa, etc.) and someone put the emails in a searchable database: [http://www.eastangliaemails.com].
An examination of the CRU emails pertaining to the Medieval Warm Period and the “unprecedented” nature of the 20th century global warming is provided here: http://www.appinsys.com/GlobalWarming/UnprecedentedWarming.htm
|
||||
|
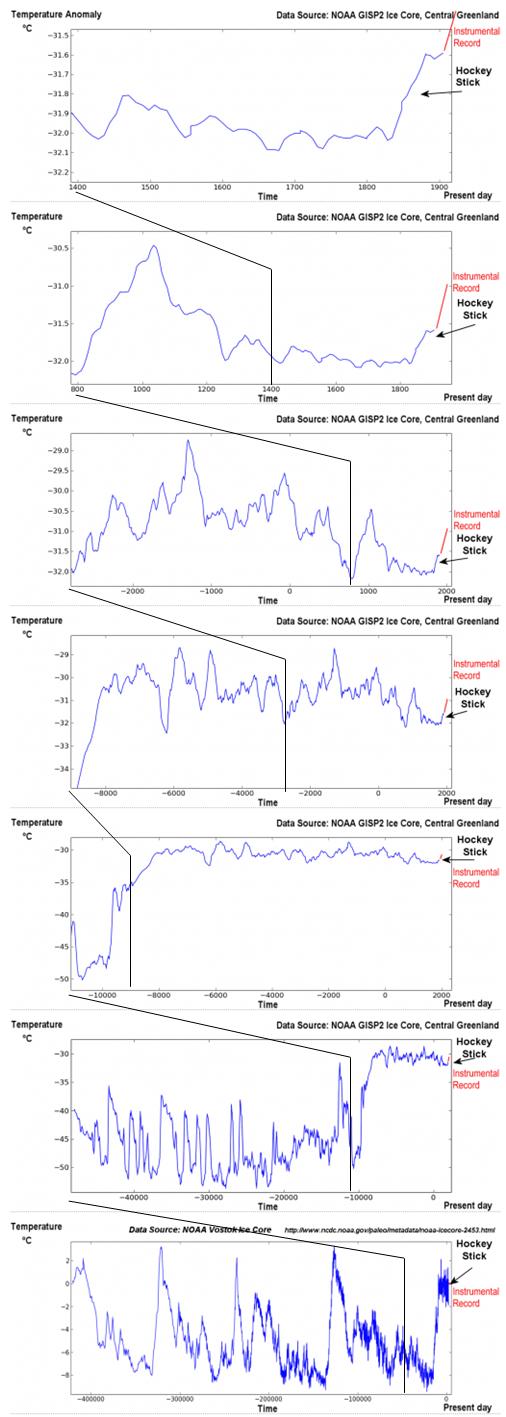
NOAA provides data sets of ice core based temperature data: Greenland: http://www.ncdc.noaa.gov/paleo/metadata/noaa-icecore-2475.html Antarctica: http://www.ncdc.noaa.gov/paleo/metadata/noaa-icecore-2453.html
The Greenland core is plotted here: http://www.foresight.org/nanodot/?p=3553 and here: http://wattsupwiththat.com/2009/12/12/historical-video-perspective-our-current-unprecedented-global-warming-in-the-context-of-scale/#more-14034 and adapted below.
|
||||
|
|