Global Warming Science - www.appinsys.com/GlobalWarming
Arctic Animal Populations
[last update: 2010/03/22]
|
The abstract for a paper published in the State of the Arctic (SOA) 2010 states: “The Arctic Species Trend Index (ASTI), like the global Living Planet Index (LPI), illustrates overall vertebrate population trends by integrating vertebrate population trend data of an appropriate standard from across the Arctic and over the last 34 years (1970 as the baseline). A total of 965 populations of 306 species (representing 35% of all known arctic vertebrate species) were used to generate the ASTI … the average population of arctic species rose by 16% between 1970 and 2004. … This increasing trend however, is not consistent across biomes, regions or groups of species.” [http://soa.arcus.org/abstracts/tracking-trends-arctic-wildlife-arctic-species-trend-index]
|
|
The Alarmist Version
The Zoological Society of London (ZSL, an ASTI partner) reports the same ASTI results from the above study by selectively reporting the bad news area: “A new assessment of the Arctic’s biodiversity reports a 26 per cent decline in species populations in the high Arctic. Populations of lemmings, caribou and red knot are some of the species that have experienced declines over the past 34 years, according to the first report from The Arctic Species Trend Index (ASTI), which provides crucial information on how the Arctic’s ecosystems and wildlife are responding to environmental change.” [http://www.zsl.org/science/news/high-arctic-species-on-thin-ice,694,NS.html] They don’t mention that the ASTI report states: “High Arctic species show an overall decline in abundance of 26% with populations levelling off in the mid-1990s.” and re: polar bears: “we are unable to ascertain the extent to which sea-ice associated species, such as polar bear, have already been affected by these [declining sea-ice] changes.”
The ZSL press release, although highly misleading, was echoed through the “science” reporting sites – Eurekalert and ScienceDaily.
The alarmist organizations need to report the news as bad news because they funded it. The ASTI partners include: (To see why the funding by WWF and UNEP (WCMC is part of UNEP) is significant see: the History of the AGW Scare.)
(The SOA conference was held in March 2010 in Miami, Florida – the participants obviously like it warm!)
|
|
The ASTI Study
The full ASTI report is available here: [http://www.asti.is/images/stories/asti%20report%20march%2017%20final%20low%20res.pdf]
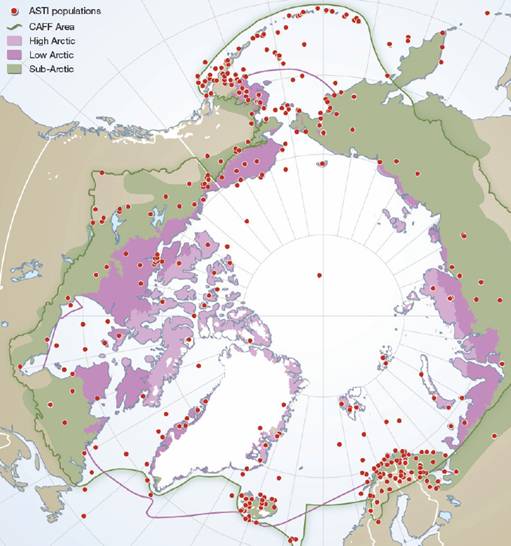
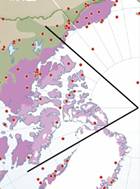
The following figure from the ASTI report shows the difference between the SOA and alarmist statements – the High Arctic is the lighter pink area (“26% decline”) while together both pink areas plus the green Sub-Arctic area represent the complete Arctic study area (“16% increase”).
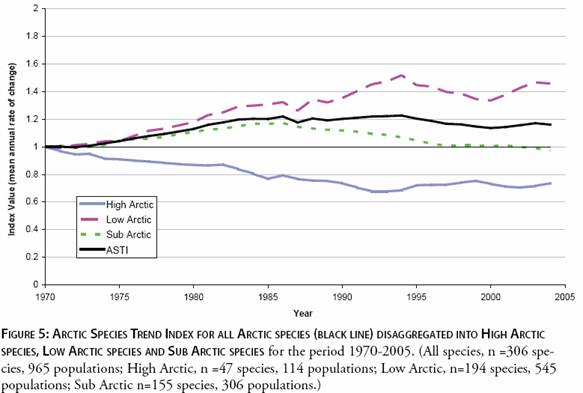
The following figure from the ASTI report shows the average population trends by area. The High Arctic decline is mainly due to lemmings and caribou declines (as mentioned in the alarmist reports). “The reasons for this decline are not known and may be due, in part, to the cyclical nature of some species and populations (e.g., Barren Ground Caribou)”
|
|
Caribou
The ASTI report goes on to state: “during two winters in the 1990s, the Peary Caribou population in the western Queen Elizabeth Islands was reduced by more than 95%. This was due to heavy snow conditions and the presence of ice layers in the snow that made it difficult for the Caribou to reach ground forage.”
The Peary caribou in the Queen Elizabeth Islands mentioned in the SOA report “is an endangered species in Canada, having been in an overall decline since 1961” And suffered a 98% decline by 1998 “In summer 1993, 2400 caribou were counted during 33.8 h of low-level helicopter searches. In contrast, in summer 1998, only 43 caribou were seen within the same area. … Peary caribou are at the edge of the range for herbivores, as the High Arctic is close to the climatic limits for plant growth. … Peary caribou live in a ‘non-equilibrium grazing system’ where sporadic, unpredictable abiotic variables - i.e., snow and ice—usually govern the fate of the caribou over time” [http://pubs.aina.ucalgary.ca/arctic/Arctic56-4-381.pdf]
Other studies question the blame of Peary caribou decline on global warming: “The declines, however, have been spatially and temporally inconsistent among the various Peary caribou populations: some populations have increased while others have decreased. Additionally, at least two of the die-offs preceded the period of observed global warming. Moreover postulating a caribou decline because of global warming seems counter-intuitive: the extensive high latitude warming and associated cryosphere changes (e.g., longer snow- and ice-free seasons) that have been documented in the northern hemisphere in recent decades, consistent with predictions of greenhouse gas-forced global warming (Zhang et al. 2000; Brown and Alt 2001; Whitfield et al. 2002), should improve survival, not lessen it. Therefore, a review of the hypothesized connection between Peary caribou populations and climate change is warranted.” [http://www.llbc.leg.bc.ca/public/pubdocs/bcdocs/400484/harding_edited_final_april_19.pdf]
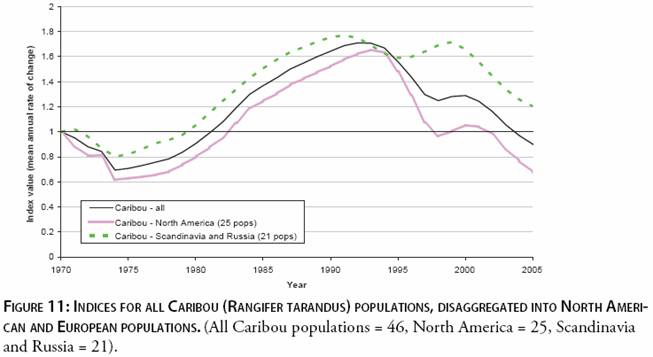
Regarding caribou in general, the report states: “The population trends shown in Figure 11 are clearly cyclical and also show striking similarities between Eurasia and North America, suggesting that there may be circumpolar factors underlying these trends.” And: “The largest herd in Russia, the Taimyr, peaked at around one million animals in 2000. Although recent declines are thought to be part of a natural cycle, there is growing concern about the negative impacts of climate change.” So the caribou trend is thought to be a natural cycle, but be afraid of climate change.
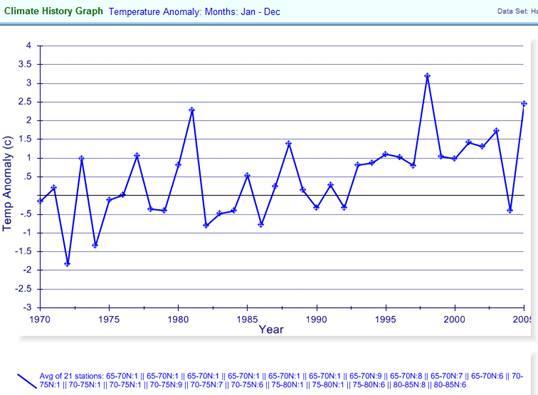
The following figure shows the annual average temperature anomaly data for the area bounded by 65-90N x -60-135W (the North America High Arctic caribou area as indicated to the right). The graph is the average of the 5x5 degree grids in the Hadley / CRU data (plotted at http://www.appinsys.com/GlobalWarming/climate.aspx)
The next figure shows the temperature data from above compared to the caribou population. There is no correlation between the two.
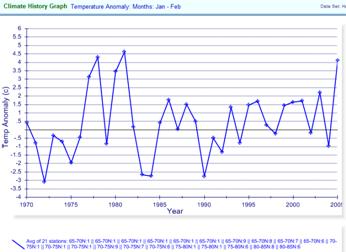
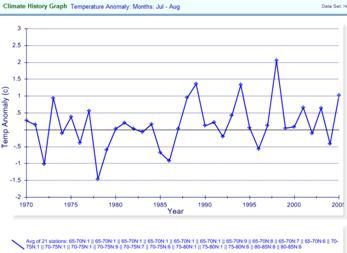
The following figures show the average Jan-Feb (left) and Jul-Aug (right) temperature anomalies for the same area as above for 1970 - 2005.
No correlations here between temperature and caribou populations either.
|
|
Mammals
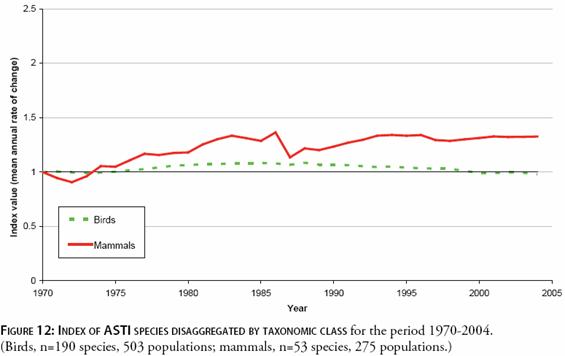
The following figure from the ASTI report shows increasing Arctic mammal species populations.
|
|
Marine Species
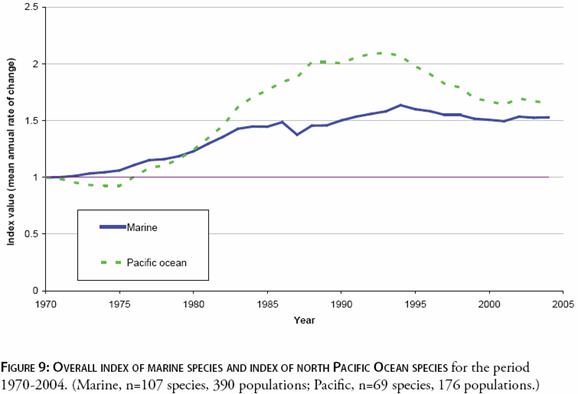
The following figure from the ASTI report shows increasing Arctic marine species populations.
|
|
Conclusion
The data do not show declining Arctic animal populations during the global warming era of the late 20th century (16% increase).
The alarmists selectively cherry-pick data to spin their scare stories (26% decrease in the “high” Arctic – just ignore those natural cycles).
The Zoological Society of London states: “Co-author Christoph Zöckler from the UNEP-World Conservation Monitoring Centre says: “The establishment of these results comes at a crucial time for finding accurate indicators to monitor global biodiversity as governments strive to meet their targets of reducing biodiversity loss.” Since the results show no biodiversity loss, it seems that governments are meeting their targets.
|
|
Hat tip to http://hockeyschtick.blogspot.com/ for the reference to the ASTI study. See also: http://www.appinsys.com/GlobalWarming/GW_4CE_Animals.htm for details on animals and AGW See also: http://www.appinsys.com/GlobalWarming/RS_Arctic.htm for a detailed study of the Arctic climate
|