Global Warming Summary series at www.appinsys.com/GlobalWarming
U.S. GCCRP Report - Climate Change Impacts on the Northwest
[last update: 2009/06/24]
|
The U.S. Global Climate Change Research Program of the National Science and Technology Council has released a new report “Global Climate Change Impacts in the United States” (June 2009) [http://downloads.globalchange.gov/usimpacts/pdfs/climate-impacts-report.pdf]. The report basically repeats statements from the IPCC AR4 and applies the IPCC-based global predictions for the future to the United States.
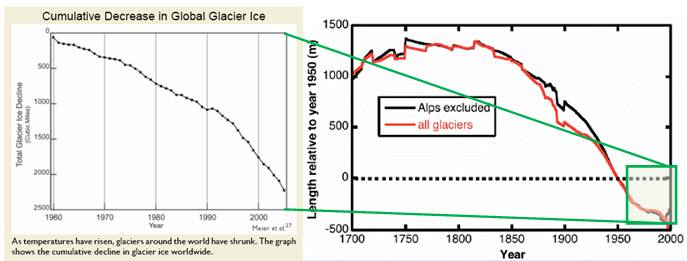
The report uses the standard alarmist technique of short-term context. For example, page 18 of the report shows a figure of glaciers melting since 1960 (below left). But the long-term context ignored by the report shows glaciers melting from the early 1800s when CO2 was not an issue (below right – see http://www.appinsys.com/GlobalWarming/GW_4CE_Glaciers.htm for more information on glaciers, which have been decreasing in size since the Little Ice Age ended).
|
|
The report has several sections – this document reviews only one section – regional climate impacts on the Northwest. [http://www.globalchange.gov/publications/reports/scientific-assessments/us-impacts/regional-climate-change-impacts/northwest]
|
Northwest
|
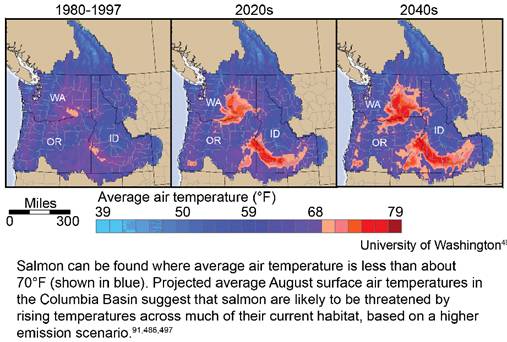
The report section on the Northwest states: “Studies suggest that about a third of the current habitat for the Northwest’s salmon and other coldwater fish will no longer be suitable for them by the end of this century due to climate change”, and provides the following figure.
It is interesting from the above figure, that CO2-based warming is expected to only occur in very specific areas instead of in the whole region.
|
|
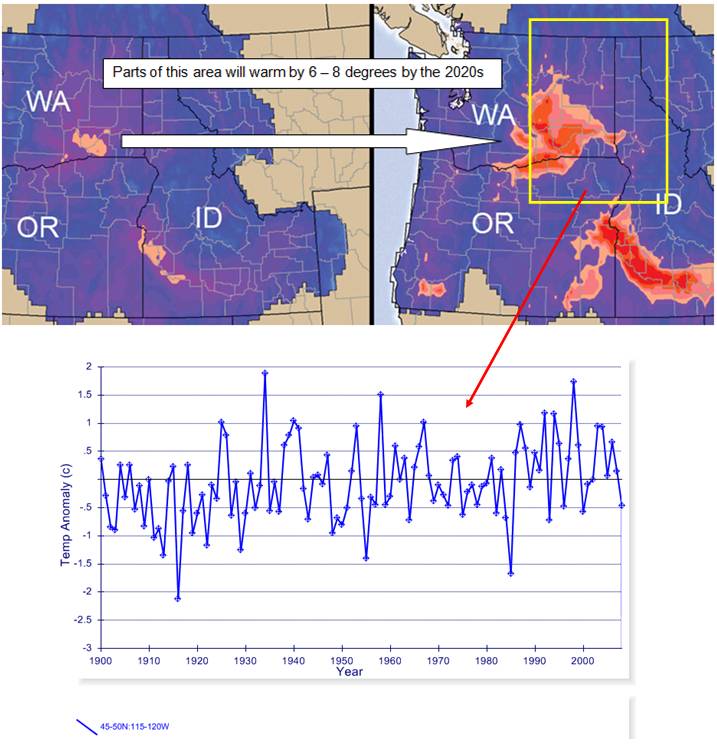
The IPCC uses gridded data (5x5 degree grids) provided by the Hadley Climatic Research Unit (HadCRU). The following figure shows the 45-50N x 115-120W grid and the annual average temperature anomaly from the HadCRU CRUTEM3 database (plotted at: http://www.appinsys.com/GlobalWarming/climate.aspx). No significant long-term warming trend is observed.
|
|
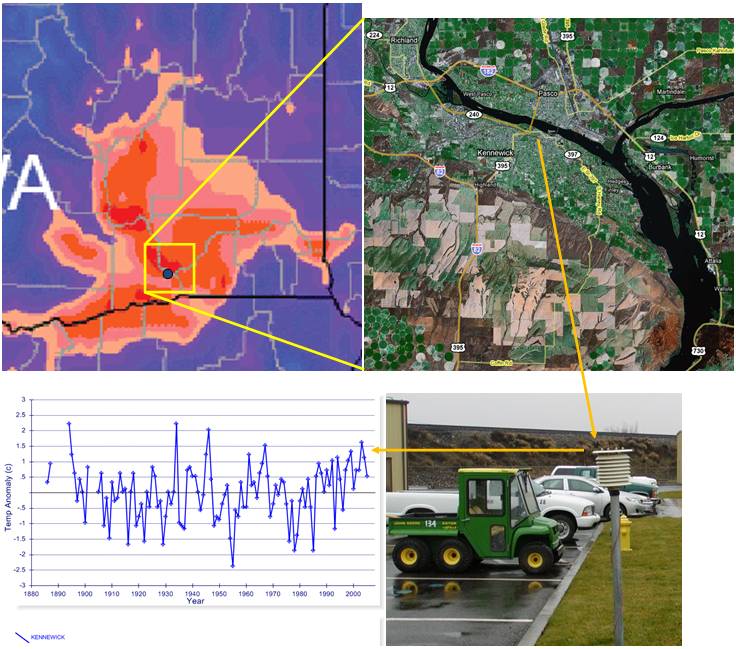
There are only a few stations in the US Historical Climate Network within the area. The following figure shows the location of the Kennewick station in one of the areas that is expected to warm significantly. This is a poorly sited station according to NOAA’s rules since it is right beside a parking lot at the sewage plant. The warming trend at this urban station started when the equipment was changed to an MMTS electronic sensor system in 1986 and it was moved to beside the parking lot. (Location information available at http://mi3.ncdc.noaa.gov). Of course invalid stations are not thrown out when trying to show warming.
(The above figure contains: aerial photo from Google, station photo from SurfaceStations.org [http://gallery.surfacestations.org/main.php?g2_itemId=4968], and annual average temperature anomaly from the NOAA database plotted at http://www.appinsys.com/GlobalWarming/climate.aspx)
|
|
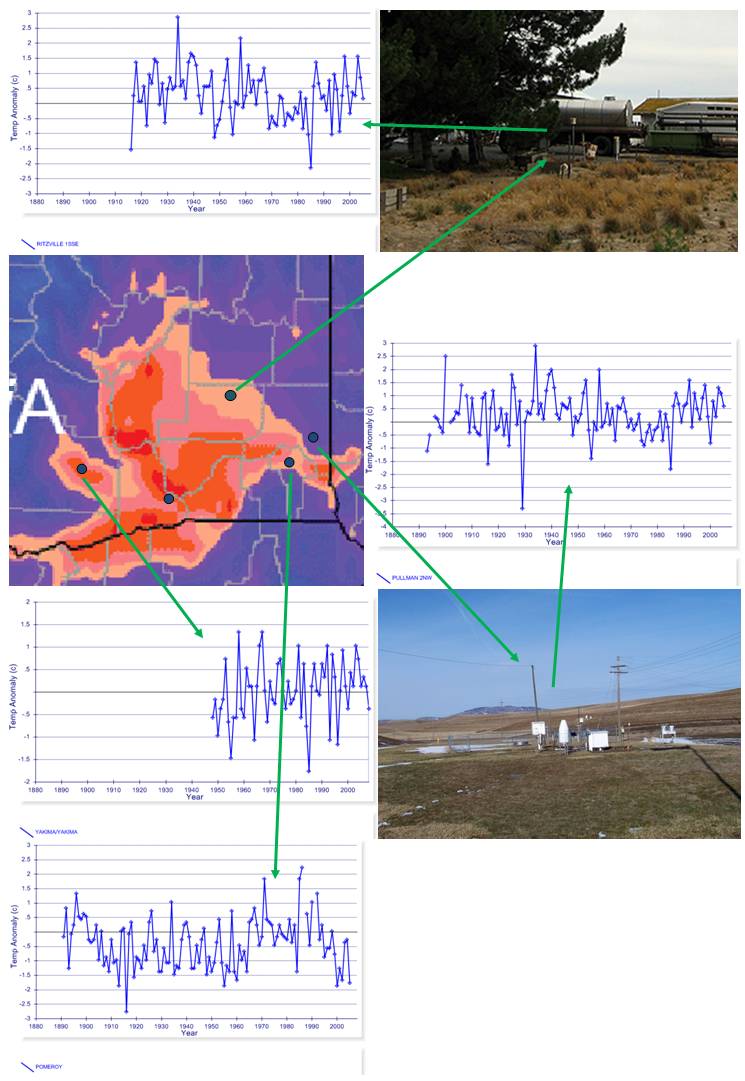
The following figure shows the other stations in the USHCN in the area. No long-term warming is exhibited at any of the stations. Rural stations where there is no significant land use change do not show a warming trend.
|
|
Why do they say that specific areas will warm so much when most of the area will not warm? Good question. They blame it on CO2 – but CO2 is rising uniformly throughout the area – therefore the area should experience a consistent temperature increase. But instead they highlight very localized specific areas that will have warming.
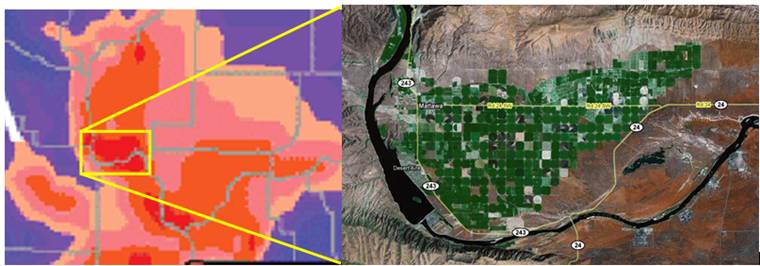
The following figure shows an aerial photo of an area said to be expected to warm 6 – 8 degrees. There is no USHCN station in this area, but the reason for the warming is obvious. Introducing center-pivot irrigation into a desert area increases the specific humidity of the local lower atmosphere resulting in increased temperatures (although ground-level temperatures during irrigation will be cooler due to evaporation). The diversion of Columbia River water for use as irrigation water also increases the water temperature as it runs off and returns to the river, raising the river temperature.
|
|
They are conflating land use change with increased CO2 in the atmosphere. The rivers are dammed to create lakes for irrigation sources. This leads to increased warming of the water as it stands in the lake as well as increased water temperature from irrigation runoff. Blaming the results of land use changes on increased CO2 in the atmosphere is bogus science.
|
|
|