Global Warming Science: www.appinsys.com/GlobalWarming
United States – Confused About Global Warming
[last update: 2009/08/31]
|
US CO2 Emissions Down
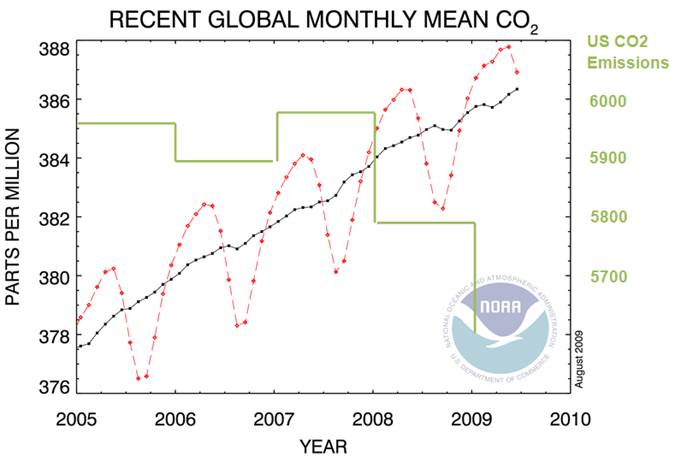
The following figure shows annual total US fossil fuel based CO2 emissions (in green – scale at right) along with the global mean atmospheric CO2. (US emissions from http://www.eia.doe.gov/emeu/mer/pdf/pages/sec1_20.pdf in million metric tons, and atmospheric CO2 from http://www.esrl.noaa.gov/gmd/ccgg/trends/)
At the time of writing this, data are only available through May 2009. Comparing the total million metric tons of CO2 for the first 5 months of 2007, 2008 and 2009:
2007: 2,502 2008: 2,478 2009: 2,276
indicates that 2009 will have a lower total of around 5,500 million metric tons.
So while the US CO2 emissions have been declining, the global atmospheric average keeps on its same linear trend that has been observed over the last few decades.
|
|
US Is The World’s Leader in Positive Land Use Change
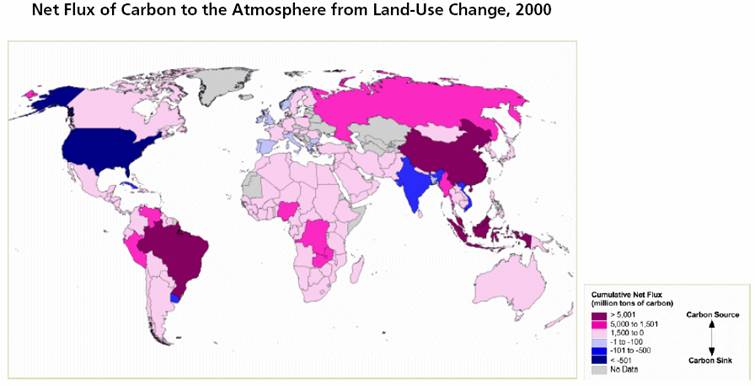
The following figure shows the net flux of carbon to the atmosphere due to land use change (which results mainly due to deforestation for agriculture and fuel-wood in the tropics and reforestation in the US). The United States has the largest land use change carbon sink in the world – i.e. while much of the world is burning its forests, the US is absorbing the carbon from the atmosphere. This figure shows: “Cumulative Emissions of C02 From Land-Use Change measures the total mass of carbon absorbed or emitted into the atmosphere between 1950 and 2000 as a result of man-made land use changes (e.g.- deforestation, shifting cultivation, vegetation re-growth on abandoned croplands and pastures). Positive values indicate a positive net flux ("source") of CO2; for these countries, carbon dioxide has been released into the atmosphere as a result of land-use change. Negative values indicate a negative net flux ("sink") of CO2; in these countries, carbon has been absorbed as a result of the re-growth of previously removed vegetation.” [http://earthtrends.wri.org/pdf_library/maps/co2_landuse.pdf].
The same report also states: “While the majority of global CO2 emissions are from the burning of fossil fuels, roughly a quarter of the carbon entering the atmosphere is from land-use change.”
|
|
Global Warming in the Satellite Data Era
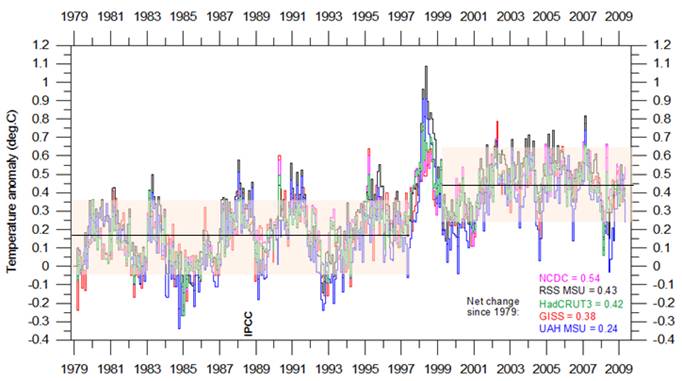
The following figure shows global average temperature from five data sets since the start of the satellite temperature data era in 1979 (RSS MSU and UAH MSU are satellite data, HadCRUT3, NCDC and GISS are surface station data sets – graph from http://climate4you.com/GlobalTemperatures.htm). From 1979 to 1997 there was no warming trend. The major El Nino then resulted in a residual warming of about 0.3 degrees. Since the 1998 end of the El Nino there has also been no warming trend – all of the warming in the last 30 years occurred in a single year. And yet this is the era that the IPCC says the warming is caused by CO2 – and alarmists are still saying that it’s getting worse. And the US government wants to take strong measures to curb the warming.
|
|
Obama Confused
On April 27, 2009, Obama addressed the National Academy of Sciences (NAS) at its 146th annual meeting in Washington, D.C. In his speech he said “Under my administration, the days of science taking a backseat to ideology are over.” [http://www.pnas.org/content/106/24/9539.abstract].
Obama shows his grasp of science and the CO2 issue: "At a time of great fiscal challenges, this legislation is paid for by the polluters who currently emit the dangerous carbon emissions that contaminate the water we drink and pollute the air we breathe” (from “Obama urges Congress to move swiftly on climate change bill” [http://www.guardian.co.uk/environment/2009/jun/23/obama-climate-change-congress])
|
|
Perspective
A study published in 2008 reported that China became the largest emitter of CO2 in 2006. (Gregg, J. S., R. J. Andres, and G. Marland, “China: Emissions pattern of the world leader in CO2 emissions from fossil fuel consumption and cement production”, Geophysical Research Letters 35, 2008) The study states: “the annual emission rate in the US has remained relatively stable between 2001–2006 while the emission rate in China has more than doubled.” [http://www.agu.org/pubs/crossref/2008/2007GL032887.shtml].
The following figure shows global greenhouse gas emissions (GHG) by type from the 2007 IPCC AR4 SPM [http://www.ipcc.ch/pdf/assessment-report/ar4/syr/ar4_syr_spm.pdf]. Note that CO2 fossil fuel use is 56.6 % of GHG globally. In 2004 the United States produced about 22 % of the global fossil fuel based CO2 emissions [http://www.eia.doe.gov/bookshelf/brochures/greenhouse/Chapter1.htm]. Thus, even if the United States eliminated all automobiles and all fossil fuel based electricity generation, etc – global GHG would be reduced by only 12 %.
|
|
Other Factors
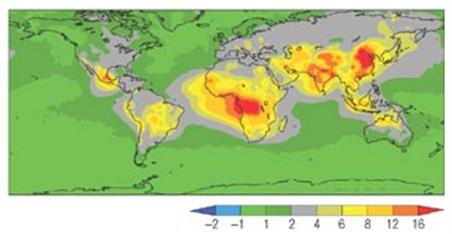
The following figure shows the atmospheric solar heating due to black carbon, indicating the regional areas of major black carbon emissions [http://www.nature.com/ngeo/journal/v1/n4/full/ngeo156.html].
“In their frantic search for a solution to the global warming crisis, climatologists and policy makers have managed to overlook one of the leading causes of rising world temperatures - soot, the familiar black residue that coats fireplaces and darkens truck exhaust. ``Soot - or black carbon - may be responsible for 15 to 30 percent of global warming, yet it`s not even considered in any of the discussions about controlling climate change,`` says Stanford Professor Mark Z. Jacobson” [http://www.sciencedaily.com/releases/2001/02/010208075206.htm]
See: http://www.appinsys.com/GlobalWarming/Deforestation.htm And http://www.appinsys.com/GlobalWarming/BiomassBurning.htm
|