Regional Summaries
This document provides a brief summary of the findings of each of the Regional Summary documents (summaries in the table below).
According to the IPCC AR4 report – The Physical Basis of
Climate Change, 2007 [http://ipcc-wg1.ucar.edu/wg1/wg1-report.html], the
following statements are true:
“Models do not reproduce the observed temperature changes equally well in all regions [emphasis added]. Areas where temperature changes are not particularly well simulated by some models include parts of North America and mid-Asia”
“Difficulties remain in attributing temperature changes on smaller than continental scales and over time scales of less than 50 years. Attribution at these scales, with limited exceptions, has not yet been established [emphasis added]. Averaging over smaller regions reduces the natural variability less than does averaging over large regions, making it more difficult to distinguish between changes expected from different external forcings, or between external forcing and variability. In addition, temperature changes associated with some modes of variability are poorly simulated by models in some regions and seasons. Furthermore, the small-scale details of external forcing, and the response simulated by models are less credible than large-scale features.”
The following figure from the AR4 provides the results of models for sub-continental regions.
Figure 9.12 in IPCC AR4
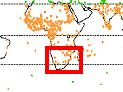
The
NASA Goddard Institute for Space Studies (GISS) is a major provider of climatic
data in the US. The following figure shows the distribution of temperature
stations used by the GISS. As can be seen in the Figure, the 30 to 60 degree
North latitude band contains 69 percent of the stations used and more than half
of those are located in the United States. This implies that if these stations
are valid, the calculations for the US should be more reliable than for any
other area or for the globe as a whole, due to the greater availability of
data.
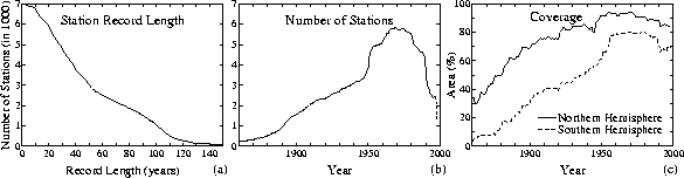
The number of temperature reporting stations changes with time. The GISS web site shows how the number of stations has changed as shown in the following figure [http://data.giss.nasa.gov/gistemp/station_data/ ] Note that in the figure c) the definition of percent coverage is based on “percent of hemispheric area located within 1200 km (720 miles) of a reporting station”.
See the Part 3 document “The Measurement of Global Temperatures” for a more detailed discussion of the changing coverage of stations [www.appinsys.com/GlobalWarming/GW_Part3_GlobalTempMeasure.htm]
Many areas that display warming exhibit warming starting before temperature records are available. In many places there is a distinct difference between urban and rural stations. In many areas temperatures are just starting to get above those recorded in the 190’s – 1940s. One problem in the details is that often stations with just a few years of partially overlapping data are averaged together to give the impression of a long-term trend. As a result the graphs in the following table don’t tell the actual story – the details need to be examined.
The following table provides a summary of the regional summary documents. The figures in the first column show the model results from the IPCC AR4 9.12 shown above, combined with the average temperature trend from the second column.
|
Region |
Summary |
|
|
|
||
|
Antarctica |
||
|
IPCC does not try to predict Antarctica. |
IPCC acknowledges that Antarctica does not fit the models due to “insufficient observations”. Very few temperature stations in Antartica. No warming is occurring since 1950 except in the Antarctic Peninsula. Ice sheet is thickening in the middle, melting at the edges, for close to zero net change in ice volume. |
|
|
|
||
|
Greenland |
||
|
|
|
Very few temperature stations in Greenland / Iceland. Current warming similar to 1930’s – 1940’s. Very small net ice mass change.
|
|
|
||
|
Alaska |
||
|
|
|
Very few long-term temperature stations in Alaska. Current warming similar to 1920’s.
|
|
|
|
|
|
United States |
||
|
|
|
About 30 % of the world’s temperature stations exist in the U.S. The 1930’s were similar to the present warming.
|
|
|
||
|
Western North America |
||
|
|
|
Very many temperature stations exist in Western North America, mainly in the U.S. The urban stations show quite a different trend than the rural stations, affecting the average trend.
|
|
|
|
|
|
Central North America |
||
|
|
|
Very many temperature stations exist in Central North America, mainly in the U.S. The 1930’s were warmer than the present. The current temperatures are actually within the range from the models without CO2.
|
|
|
|
|
|
Eastern North America |
||
|
|
|
Very many temperature stations exist in Eastern North America, mainly in the U.S. Only one year has been warmer than the 1930s. There is a major intra-regional difference between the northeast and southeast.
|
|
|
||
|
South America |
||
|
|
|
Very few long-term temperature stations in South America. Western South America exhibits cooling. Southern South America shows no warming.
|
|
|
||
|
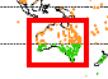
Australia |
||
|
|
|
Very few long-term temperature stations in Australia. Northern Australia shows long-term warming, but not south (shown at left).
|
|
|
||
|
Southern Africa |
||
|
|
|
Very few temperature stations in southern Africa. Only the urban stations actually exhibit warming since 1880.
|
|
|
||
|
East Africa |
||
|
|
|
No long-term few temperature stations in east Africa. Current temperatures similar to 1930’s. Mount Kilimanjaro not melting – disappearance due to sublimation.
|
|
|
|
|