Global Warming Science: www.appinsys.com/GlobalWarming
Puffins – Isle of May, Scotland – Global Warming Blamed for Decline
[last update: 2010/03/21, original: 2010/01/16]
|
Reported in UK’s Independent, 4 June 2008: “Researchers on the Isle of May, home to the largest puffin colony in the North Sea, have found that after 40 years of steady increase the resident population has plummeted by almost a third in the past five years. … Puffin numbers on the island have fallen from 69,300 pairs of the birds in 2003 to 41,000 pairs today.” The mainstream media blame it on global warming. “The exact cause of the dramatic fall in numbers remains a mystery, but Professor Harris believes the decline could be the result of climate change. He says that as the seas warm up, it is affecting the numbers of fish available for the puffins to eat.” http://www.independent.co.uk/environment/nature/warmer-seas-blamed-for-rapid-decline-of-scottish-puffin-colony-839600.html
[2010/03/21 update at end of document]
|
|
Puffins on the Isle of May
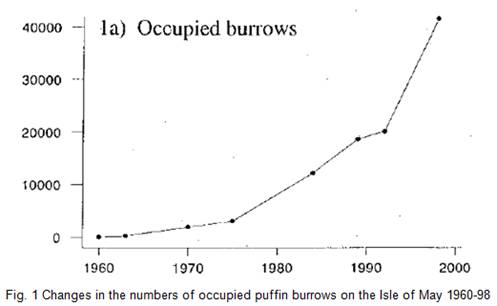
A 1998 study “Status of the Puffin Fratercula Acrtica on the Isle of May National Nature Preserve” by Harris and Wanless, states: “The history of the puffin on the Isle of May is well documented … in 1883 there were 30-40 pairs … the population was put at 5-10 pairs in the early 1950s but in 1957-58 at least 50 pairs attempted to form a colony. This attempt was brief and unsuccessful and in 1960 there were only a few pairs.” [http://nora.nerc.ac.uk/4711/1/N004711CR.pdf] So this largest puffin colony in the UK barely existed until the 1970s when both global warming and the puffin population took off.
The following figure is from the above-mentioned study.
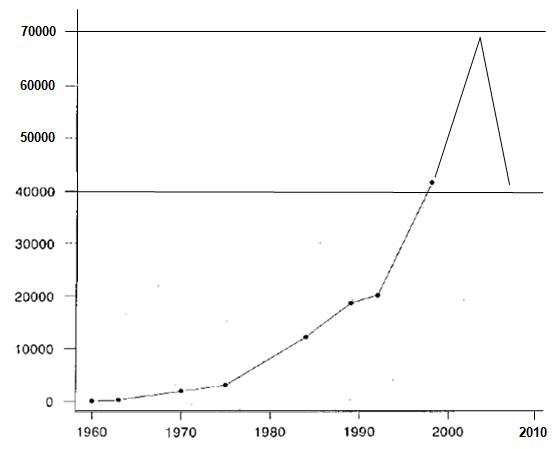
Adding in the data points from the Independent article cited above “fallen from 69,300 pairs of the birds in 2003 to 41,000 pairs today [2008]” provides the following graph:
Populations experiencing exponential growth do not do so for long. See: http://users.rcn.com/jkimball.ma.ultranet/BiologyPages/P/Populations2.html
|
|
Correlation To Sea Surface Temperatures
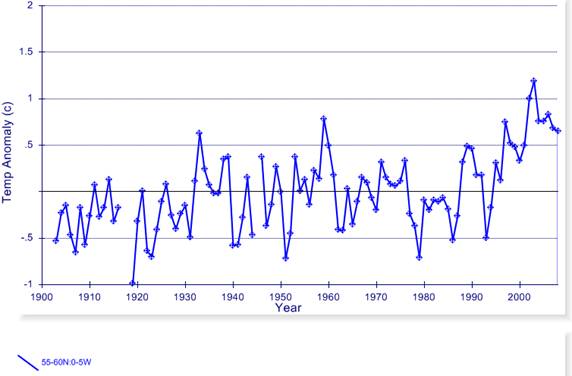
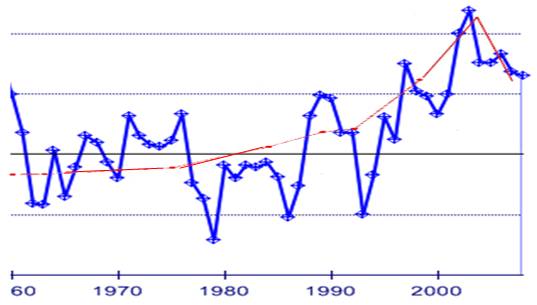
The following figure shows sea surface temperatures (SST) from the Hadley Climatic Research Unit (HadCRU) SST database (HadSST2) for 1900 to 2008 for the 55-60N x 0-5W grid, which includes the Isle of May (plotted at [http://www.appinsys.com/GlobalWarming/climate.aspx]) (Hadley provides 5x5 gridded data.)
The following figure shows the puffin population for 1960 to 2008 shown previously (changed to red) superimposed on the SST for the area from above for 1960 to 2008.
There is a clear positive correlation between SST and puffin population, contradicting the claim that global warming is causing decline in the puffin population. Perhaps something else is involved.
|
|
Puffin Food
The Independent article said “He says that as the seas warm up, it is affecting the numbers of fish available for the puffins to eat. … The number of sand eels – which are a staple food for the birds – has been falling in recent years as a result of overfishing and sea temperature changes.”
Sandeels in the North Sea (Ammodytes marinus) have breeding areas restricted by suitable sediments on the sea bottom. “Sandeels have bank-affiliated resident juvenile and adult life stages coupled to specific areas of sediment. The patchy distribution of this sediment is a key constraint on the distributional extent of sandeels, following settlement. The eggs are also demersal and are spawned directly onto the sandy areas they inhabit. … There is considerable variation in size and maturity-at-age between regions and banks within the North Sea. Sandeels in coastal areas off Shetland, Norway, and off the Firth of Forth have much lower growth rates than those living offshore. … Growth rates within the North Sea stock vary substantially between regions and between years, and the patterns of emergence and thus the availability of sandeels to the fishery is also highly variable.” [http://www.ices.dk/committe/acom/comwork/report/2004/oct/Norwegian%20request%20Sandeel.pdf]
A 2006 study (Boulcott et al “Regional variation in maturation of sandeels in the North Sea” [http://icesjms.oxfordjournals.org/cgi/reprint/64/2/369] states: “Growth in sandeels is very seasonal, with the strongest period of growth between March and July after emergence from the sandy substrata in which they over-winter. When they are active, sandeels tend to emerge only during daylight to feed restricting foraging to nearby waters. A recent analysis of a 25-y time-series of sandeel size-at-age off the Firth of Forth, Scotland also indicates that sandeels there have always been slow-growing, despite a long-term decline in growth rates.”
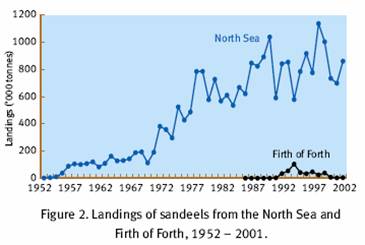
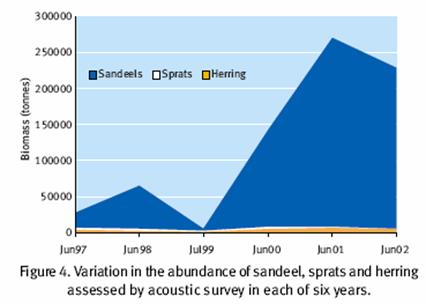
The Fisheries Research Services (Aberdeen, Scotland) has a paper: “Sandeels in the North Sea” with data through 2002 [http://www.marlab.ac.uk/FRS.Web/Uploads/Documents/ME01ASandeels.pdf]. The following figures are from that paper. The Firth of Forth (where Isle of May is located) sandeel fishery started in the 1990s and peaked at over 100,000 tonnes in 1993 – but was then stopped due to a moratorium on sandeel fishing adjacent to seabird colonies. The total North Sea sandeel catch peaked at almost 1.2 million tonnes
The following figure shows landings of sandeels from above left, changed to red, and superimposed on the average SST for three 5x5 degree grids of the North Sea (each horizontal line in the graph is a 0.5 degree increment).
The paper states: “Continued monitoring of the area using acoustic methods has shown a fivefold increase in sandeel abundance since 1999 (Figure 4)” The following figure shows the early 2000s increase in sandeels from the above paper showing the wide fluctuations that can occur in the populations.
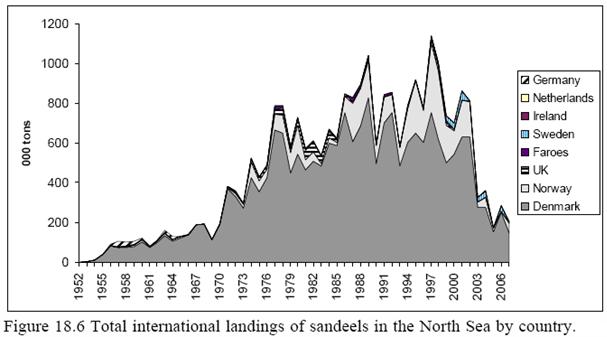
However, after 2002 the sandeel population declined – leading to the decline in the puffin population. “The sandeel, a small, silvery fish that spends most of its life buried in the sand, is at the bottom of the marine food chain and part of the diet of cod, mackerel, porpoises and birds such as arctic terns and kittiwakes in the breeding season. It has also been the basis of an "industrial" fishery in the North Sea that took about 750,000 million tons of sand-eels each year and pulped them for oil and meal used in salmon farms.” [http://www.telegraph.co.uk/news/worldnews/europe/denmark/1500985/EU-prepares-to-ban-fishing-for-sandeels-in-North-Sea.html] (I assume the article meant to say 750,000 to a million tons, as a range.)
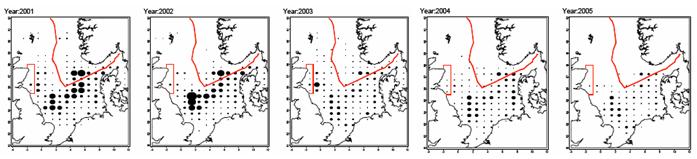
The following figure shows sandeel landings by year and ICES rectangle fro 2001 – 2005 [http://www.imr.no/filarkiv/2008/01/Nr.3_2008.pdf/nb-no]
The following figure shows total North Sea sandeel catch by country to 2007 showing the decline after 2003 [http://www.climateandfish.eu/default.asp?ZNT=S0T1O-1P192]
In 2001 the Telegraph reported: “The collapse of North Sea fish stocks has been linked for the first time to sand eel trawlermen who sweep up other immature fish species. Their vessels, using mesh as small as 5mm, catch nearly a million tons of sand eels for industrial use in the North Sea each year. The fishing for sand eels has been relatively free from regulation because scientists do not know enough about their life cycle to say that fishing for them can be damaging to other fish stocks.” [http://www.telegraph.co.uk/news/uknews/1360127/Sand-eel-trawlers-sweeping-up-fish-stocks-in-N-Sea.html]
A 2008 study ([http://www.imr.no/filarkiv/2008/01/Nr.3_2008.pdf/nb-no]) states: “The experimental fishery seems to have decimated the sandeel stock at Inner Shoal East at the I-group stage, before reaching maturity. The fact that it has been 9 year since there was an extensive fishery at Inner Shoal, suggests that local depletion may severely affect the productivity of sandeel at a fishing ground. At the Viking Bank where the productivity potential for sandeel seems to be extraordinary high, there has been no fishery since 1996, after the highest landings on records in 1995.”
A 1992 study (Monaghan: “Seabirds and sandeels: the conflict between exploitation and conservation in the northern North Sea” [http://www.springerlink.com/content/h785t57q5g262356/]) states: “The industrial fishery for sandeels is now the largest of the North Sea fisheries. A sandeel fishery in the Shetland area began in 1974 but has recently declined. This change was accompanied by dramatic declines in the breeding success of certain seabirds” In other words – overfishing of seabirds’ food source leads to seabird decline.
See: http://www.climateandfish.eu/default.asp?ZNT=S0T1O-1P192 for a complete description of sandeel biology. Sandeels do not generally feed in the winter since the water temperature is too cold and they remain buried in the sediment. It states: “Larvae also appear to be tolerant to a wide range of temperatures. Temperature is not an important factor in sandeel larval distribution (Norcross et al. 1961). Monteleone and Peterson (1986) found the water temperature during the larval season to be 0-10° C, which is similar to the temperature range of 0-13°C recorded by Richards and Kendall (1973).”
|
|
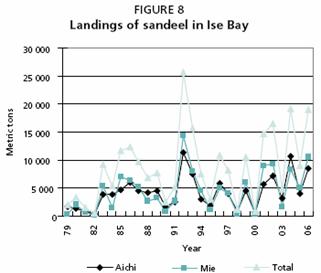
Sandeels in Japan
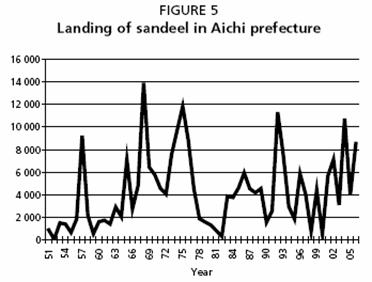
The sandeel fishery in Isle Bay Japan has been increasing in recent years after collapsing after the fishing season of 1974: “Fishing pressure was particularly concentrated in the area of the spawning grounds, a destructive conservation practice. Fishers were well aware of these facts, but intense competition forced them to disregard considerations of the damage.” [ftp://ftp.fao.org/docrep/fao/010/a1497e/a1497e18.pdf] The following figures show the sandeel landings, showing the collapse after 1974 and the recovery since then.
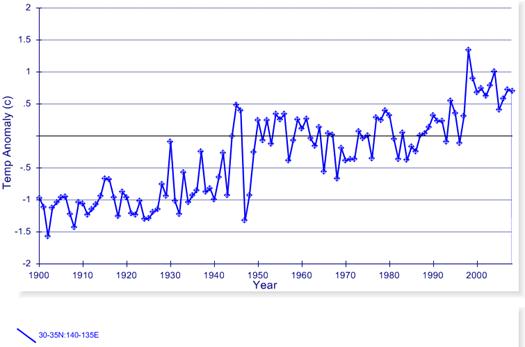
The following figure shows the sea surface temperature anomalies for the 30-35N x 135-140E grid from the HadCR SST data. [http://www.appinsys.com/GlobalWarming/climgraph.aspx?pltparms=HCRUS100AJanDecI188020080900110AR30-35N%3a140-135Ex]
Apparently warming waters are not a problem for sandeels in Japan.
|
|
Sandeel Food
Puffins are not directly affected by the changes in temperature, sandeels are not directly affected by the changes in temperature, what about sandell food?
The main food required for the growth of sandeel larvae is zooplankton (mostly Temora). Adults eat mostly copepods of the genus Calanus.
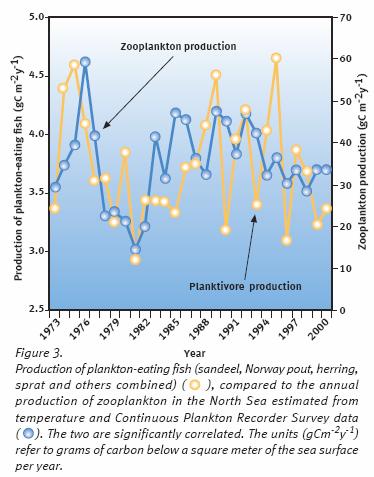
The following figure shows the North Sea zooplankton (blue line) from 1973-2000. [http://www.marlab.ac.uk/FRS.Web/Uploads/Documents/AE21Impacts.pdf]
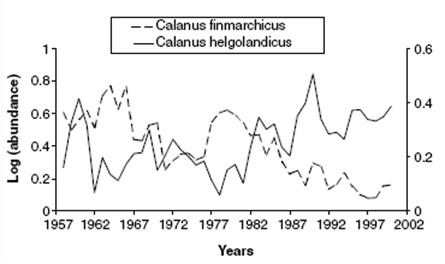
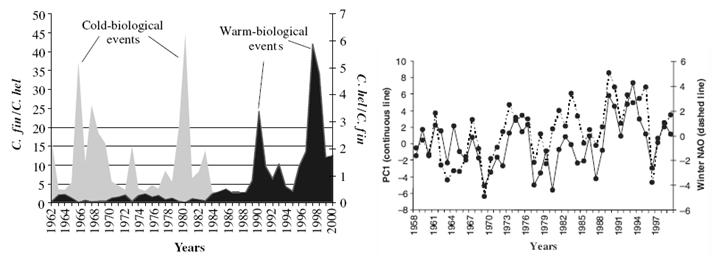
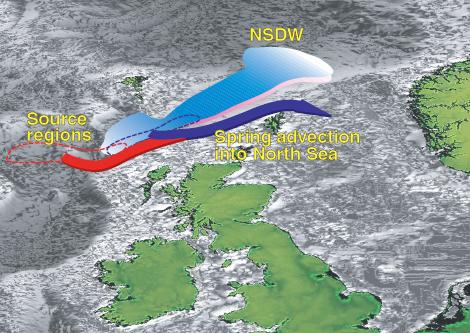
A 2003 study (Reid et al “Periodic changes in the zooplankton of the North Sea during the twentieth century linked to oceanic inflow”, Fisheries Oceanography 12:4/5, 2003 [https://bora.uib.no/bitstream/1956/412/2/bjerknes_g.pdf]) states: “The abundance of the boreal copepod C. finmarchicus and warm temperate congeneric C. helgolandicus has shown a systematic alternation in abundance in the North Sea over the last 40 years (Fig. 2). In part, this reflects the inverse correlations that the two species show with the NAO [North Atlantic Oscillation].” (Fig 2 is shown below).
The above paper notes historical incursions into the North Sea: “three major Atlantic faunal invasions and salinity anomalies occurred in the North Sea in the first half of the twentieth century during 1903–06, 1920–22 and 1931–35.” Regarding the 1931-1935 event: “This period was marked by the presence of Mediterranean water in the Faroe-Shetland Channel and exceedingly high salinities in the Southern Bight in the autumn of 1933 (Dickson, 1967). Dickson also identified hydrobiological evidence for a major inflow event based on the incursion into the Baltic from the North Sea of horse mackerel (1932) and anchovy (1933) as well as noting a dramatic rise in the anchovy stock of the southern North Sea during the period 1930–34 and the occurrence of unusual warm-water fish species. Lucas (1933) noted the presence of Atlantic thaliacea (D. gegenbauri) in the northern North Sea in 1933. Other evidence for unusual hydro-climatic conditions around this period included major phytoplankton blooms in 1933 and 1934 of Rhizolenia styliformis and Biddulphia sinensis covering 7400 squares miles in the southern North Sea and the presence of Sagitta elegans in the Thames Estuary in 1933–34 (Dickson, 1967).”
The above paper identified the following more recent North Sea events based on ratios of C.finmarchicus and C.helgolandicus (figure below left). The figure below right compares the North Atlantic Oscillation (NAO) with the first principal component analysis of water fluxes across Orkney/Utsira representing inflows from the Atlantic. (See: [http://www.appinsys.com/GlobalWarming/AO_NAO.htm] for more information on the NAO.)
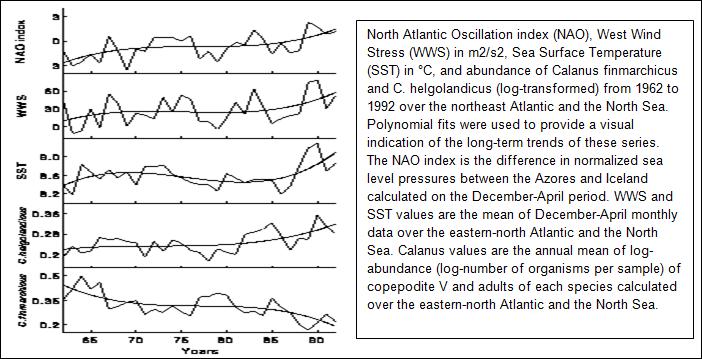
The following figure compares NAO, west wind stress (WWS), SST and zooplankton (Fromentin and Planque: “North Atlantic Oscillation and year-to-year plankton fluctuations” [http://www.sahfos.ac.uk/PDF_files/nao.html]) “We suggest that the relationship between the NAO and the two Calanus species results from three main processes: (i) alterations in the stratification of the surface layer that modify the spring phytoplankton bloom7-8, (ii) variations in sea surface temperature, and (iii) changes in interspecific competition.”
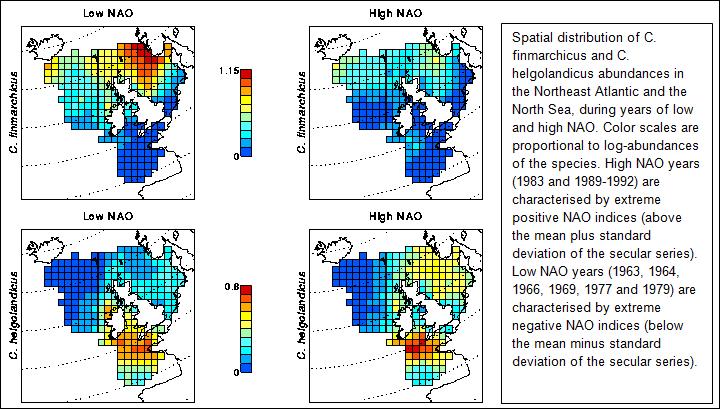
The following figure shows the spatial distribution of the two main species (C. finmarchicus - top and C. helgolandicus – bottom) from the same study as referenced above.
Another study (Pershing et al, “The Influence of Climate Variability on North Atlantic Zooplankton Populations” [http://peleg.gomoos.org/environmentalprediction/docs/OUPchapter-1.pdf]) states: “To understand many of the associations between this species and climate, it is necessary to understand its seasonal patterns. C. finmarchicus is most abundant during late spring and early summer, following the spring bloom. Starting in early summer, some C. finmarchicus postpone their development to adults, descend to depths of 400- 2000 m, and enter diapause, a state of reduced activity (Hirche, 1996; Heath et al., 2000). By autumn, most C. finmarchicus have entered diapause and their abundance near the surface is greatly reduced. The copepods begin to emerge from diapause and enter the surface waters in winter, in anticipation of the spring bloom (Miller et al., 1991). Because their overwintering strategy requires deep water, most areas on the continental shelf are too shallow to support large numbers of diapausing C. finmarchicus. Thus, even though C. finmarchicus dominates the springtime biomass in shelf regions such as the North Sea (Williams et al.; 1994), the populations of this species in shelf ecosystems should be viewed as expatriates from the open ocean populations (Greene and Pershing, 2001).”
The above study also states: “When the NAO is positive, a large area in the center of the North Atlantic is cooler, and areas to the south and east are warmer. Sea surface temperature in the North Sea is positively correlated with the NAO. The correlation is similar to that for air temperature over the North Sea, but is also related to NAO-associated changes in the water flowing into the North Sea from the Atlantic. … The 1980's were the first sustained period of positive NAO-conditions since the 1920's.”
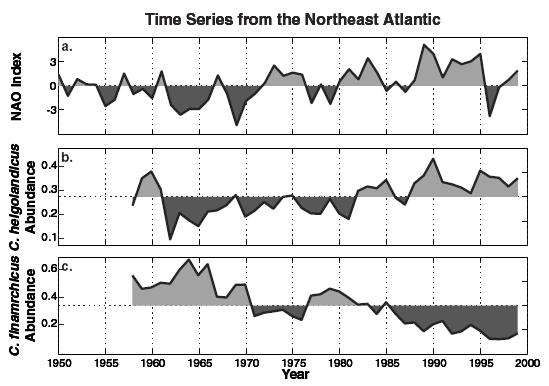
The following figures are from the above study. The top figure shows the correspondence of the two main copepod species with the NAO. The bottom figure shows the source of C. finmarchicus to the North Sea.
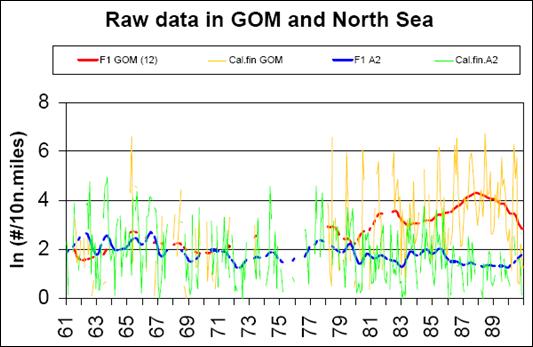
The NAO generally has opposite climatic effects across the Atlantic. The following figure compares the abundance of C. finmarchicus (Cal.fin) in the Gulf of Maine (GOM) and the North Sea (A2), verifying that opposite effects are occurring. [http://xtide.ldeo.columbia.edu/~visbeck/nao/poster/Conversi.pdf] “The transatlantic comparison (GOM vs. N. Sea) shown here confirms these differences, showing a remarkable inverse relationship between the interannual variations of this species across Atlantic. Such a long-distance association suggests that large scale physical/climatological factors dominate the interannual variability of this species: local factors, such as predation or food availability, cannot in fact sustain a decadal phase association across the ocean.”
A 2006 study “From plankton to top predators: bottom-up control of a marine food web across four trophic levels” (Frederiksen et al, Journal of Animal Ecology, 2006 [http://www3.interscience.wiley.com/journal/118727130/abstract?CRETRY=1&SRETRY=0]) stated: “the failing recruitment to adult sandeel stocks and the exceptionally low seabird breeding productivity in 2004 were not associated with low sandeel larval biomass in 2003, so other mechanisms (e.g. predation, lack of suitable food after metamorphosis) must have been important in this case”
The 2008 zooplankton monitoring program stated: “In April 2008, the average zooplankton biomass in the northern North Sea was dominated by the large herbivorous copepod Calanus finmarchicus, but with an increasing proportion of C. helgolandicus west- and southward in the area. The average biomass of zooplankton in coastal waters in Skagerrak in 2008 was close to the mean value for 1994–2008.” [http://www.imr.no/temasider/havomrader_og_okosystem/nordsjoen_og_skagerrak/living_marine_resources/en]
The data show a long-term decline in C. finmarchicus since data were first collected in the 1950s – i.e. before warming attributed to CO2. This decline correlates with a positive NAO.
|
|
Welsh Puffins
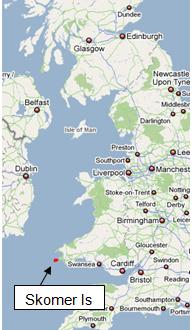
July 2009: “This magnificent colony of puffins [Skomer Island] has begun its annual migration from Wales to the North Atlantic after a record breeding season. Unlike the rest of the UK, the number of puffins on the island has soared in recent years … The island currently has a puffin population of more than 13,500 - up from 10,000 last year - with more expected to arrive next March.” [http://www.telegraph.co.uk/earth/wildlife/5918525/Puffin-migration-begins-after-record-breeding-season.html]
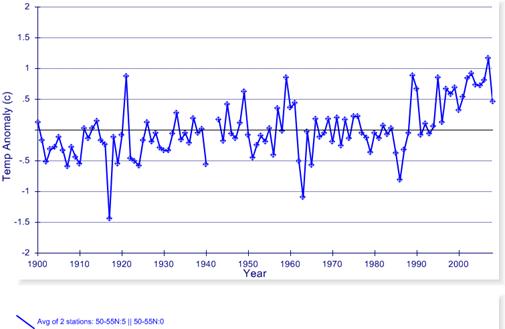
The following figure shows the SST for the two 5x5 degree grids adjacent to Skomer Island (50-55N x 0-5W and 5-10W). So in this case, the recent warmer sea temperatures resulted in “the number of puffins on the island has soared in recent years”. The article also states: “We think it may be because of the increased numbers of sandeels which the puffins feed on”.
|
|
Conclusion
As usual when anthropogenic CO2-based global warming (a.k.a. “climate change”) is blamed for something, investigation reveals a lack of evidence to support the alarmists’ position. In this case puffins decline at Isle of May – blame it on global warming. A coincident increase of puffins at Skomer Island is not attributed to global warming.
Puffins’ main food – sandeels – may have declined as a result of overfishing combined with natural variations in the sandeels’ food - zooplankton populations. The zooplankton species composition is affected by the NAO with positive NAO resulting in higher sea surface temperatures in the North Sea. This correlates with a shift in the composition of zooplankton species.
A 2008 article in Science Daily (“North Atlantic Warming Tied To Natural Variability”, Jan 2008 [http://www.sciencedaily.com/releases/2008/01/080103144416.htm]) reported on a Duke University study of North Atlantic temperatures and their relation to the NAO. “while the North Atlantic Ocean's surface waters warmed in the 50 years between 1950 and 2000, the change was not uniform. … "It is premature to conclusively attribute these regional patterns of heat gain to greenhouse warming," … "We suggest that the large-scale, decadal changes...associated with the NAO are primarily responsible for the ocean heat content changes in the North Atlantic over the past 50 years," the authors concluded. … “The take-home message is that the NAO produces strong natural variability"”
|
|
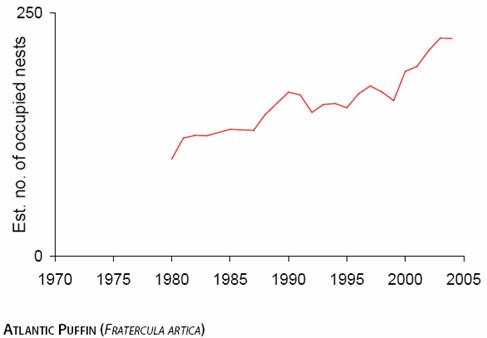
Update: 2010/03/21: The Arctic Species Trend Index (ASTI) report (March 2010) shows increasing numbers of Atlantic puffin [http://www.asti.is/images/stories/asti%20report%20march%2017%20final%20low%20res.pdf]
|
|
|