Global Warming Science - www.appinsys.com/GlobalWarming
Global Temperature Prediction from Recurrent Cycles
[last update: 2009/07/18]
|
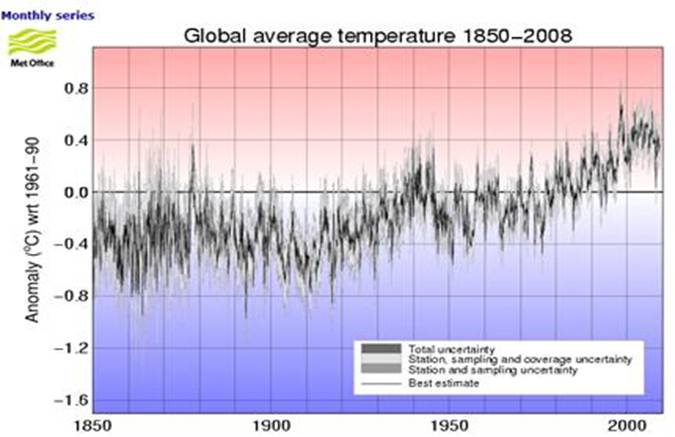
Global Average Temperature According to the IPCC
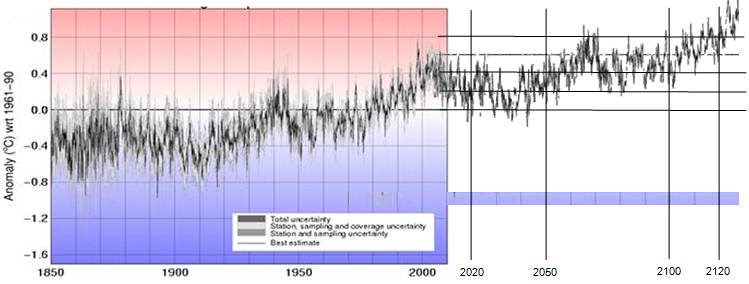
The following figure shows global temperature anomalies 1850 – 2008 (Hadley Centre data used by IPCC [http://hadobs.metoffice.com/hadcrut3/diagnostics/global/nh+sh/])
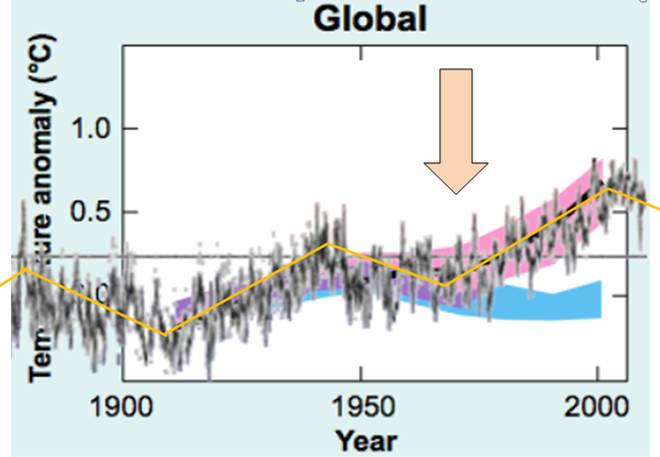
The following figure superimposes the above temperature anomalies on the IPCC graph of model outputs. (IPCC 2007 AR4 Figure SPM-4 [http://www.ipcc.ch/pdf/assessment-report/ar4/syr/ar4_syr_spm.pdf])
In the above figure, the blue shaded bands show the result of 19 simulations from 5 climate models using only the natural forcings. Red shaded bands show the result of 58 simulations from 14 climate models including anthropogenic CO2. This clearly shows that prior to about 1972, the global warming is fully explained by climate models using only natural forcings (i.e. no human CO2). The models need input of CO2 only after 1972 – prior to 1972 all warming was natural, according to the IPCC models.
|
|
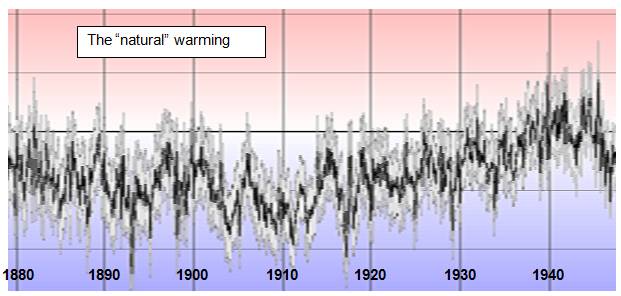
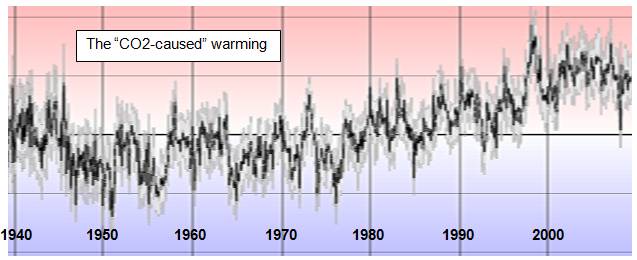
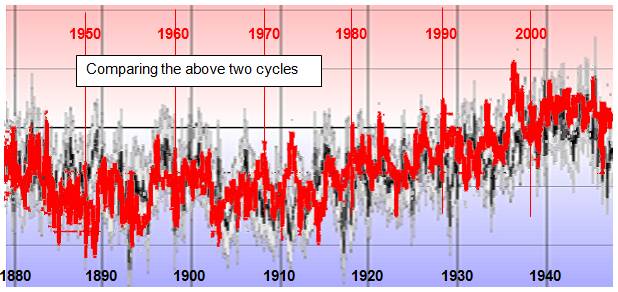
The following figures show the global temperature anomalies from the Hadley figure shown previously. Top figure: 1880-1946; middle: 1940-2008; and bottom: 1942-2008 changed to red and overlaid on 1880-1946 (shifted by 0.3 degrees).
As can be seen from the above figures, the two cycles were nearly identical, and yet the IPCC says the models can explain the early 1900s cycle with natural forcings, but anthropogenic CO2 is needed for the later cycle! There appears to be a problem with the models.
There is an overall upwards net trend in the cycles due to the fact that the earth has been warming since the Little Ice Age: “The coldest time was during the 16th and 17th Centuries. By 1850 the climate began to warm.” [http://www.windows.ucar.edu/tour/link=/earth/climate/little_ice_age.html]
|
|
The Prediction
Based on the available global data shown above, I make the following prediction for the global average temperature over the next 100 years. From the early 2000s anomaly of 0.4, I predict there will be an additional 0.2 degree increase by 2100.
Comparison with the IPCC
The following figure compares my prediction (in purple) with the IPCC AR4 projections under various scenarios. My prediction matches fairly closely to the “year 2000 constant concentrations” scenario. The warming in my projection could actually be a result of CO2 – but without the positive feedback due to water vapor assumed by the IPCC models.
|