Phoenix, AZ
This document provides an examination of the urban heat effect in Phoenix Arizona.
The graph below left shows annual mean temperature for the Sky Harbor station. The graph below right compares the annual mean with the annual average minimum and maximum temperatures. The significant increase in minimum temperature (green) while there is almost no change in maximum temperature (red) indicates the urban heat effect. The annual mean temperature has been increasing due to the fact that the minimum nighttime temperature has been increasing – i.e. it is not getting warmer in the day, it is just not cooling off as much at night.

Left
– Mean Temperature 1880 – 2007; Right
– Average Max. Temp (Red), Min. Temp (Green), Mean Temp (Blue)
The next graph below left provides a comparison of Sky Harbor to Roosevelt -- the nearest rural station with current data. For Roosevelt the current warming is within the historical range of temperatures. The graph below right compares the annual mean with the annual average minimum and maximum temperatures for Roosevelt. Unlike the urban Sky Harbor station, the rural Roosevelt station does not exhibit nighttime warming.
The next graph below left provides a comparison of Sky Harbor, Roosevelt and Childs -- another rural station with current data north of Phoenix. Childs is exhibiting a cooling trend over the last 50 years. The graph below right compares the annual mean with the annual average minimum and maximum temperatures. Unlike the urban Sky Harbor station, the rural Childs station exhibits nighttime cooling.

The next graph below left provides a comparison of Sky Harbor, Roosevelt and Childs in terms of annual average maximum temperature (which occurs during daytime), while the graph below right compares the annual average minimum temperatures (which occurs during nighttime). The urban heat effect is very noticeable.

Warren Meyer and his son drove I-17 north from Phoenix measuring temperatures from the city center out to the rural area on cloudless nights when the wind was less than 5 mph. The following figure shows how the temperature decreases with distance from the city center [http://www.climate-skeptic.com/2008/02/measureing-the.html].
East of Phoenix there is a rural station that exhibits recent warming: Miami, AZ. The following graphs show the mean annual temperature (left) and the average annual mean (blue), maximum (red) and minimum (green) temperature (right).
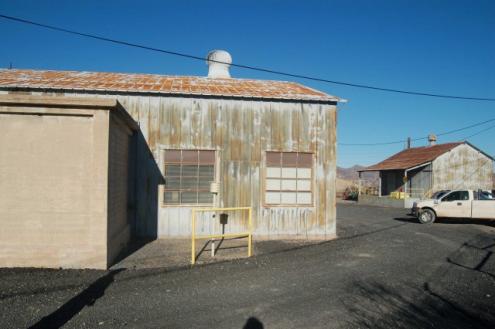
Surfacestations.org shows why a rural station exhibits this type of warming: the following picture shows the current location of the temperature measurements [http://gallery.surfacestations.org/main.php?g2_itemId=1587], sited beside a building and parking area. The measurement location had been moved from a more open area near the mine pit to the buildings area in 1993 and again in 1996 as shown on the aerial photo below the station photo.