Global Warming Science - www.appinsys.com/GlobalWarming
Pacific Northwest – No May Warming in 100 Years
[last update: 2022/06/26]
|
Pacific Northwest / Seattle May Temperature
May 2022 NOAA temperature data is now available. Here we take a look at the climate emergency evident in the May temperature trend. The data below drill down through Pacific Northwest regional to Seattle data.
If global warming / CO2 climate change / climate emergency were real, it should be evident in the data.
The following graphs show the official NOAA maximum temperature data for the last 100 years for May, plotted at https://www.ncdc.noaa.gov/cag/statewide/time-series
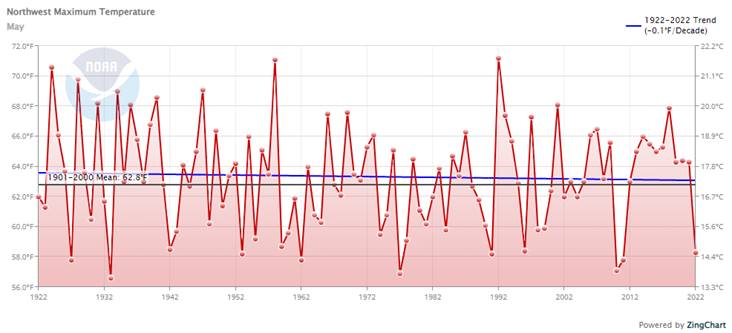
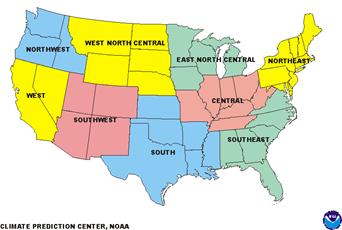
Northwest Climate Region
NW: May 1922 – 2022 trend: -0.1 degrees per decade (not statistically significant from zero trend)
May 2022 – One of the 10 coldest Mays of the last 100 years
NW Region: Washington, Oregon, Idaho:
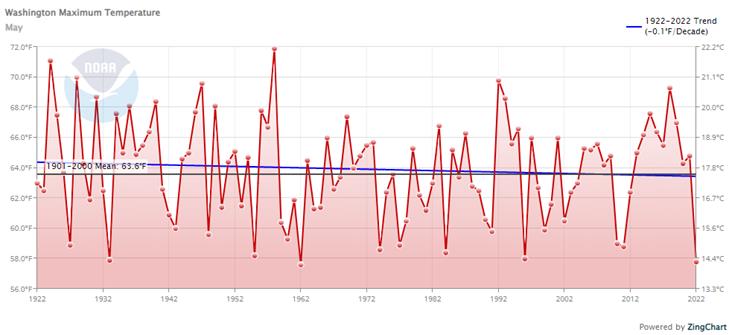
State of Washington
WA: May 1922 – 2022 trend: -0.1 degrees per decade (not statistically significant from zero trend)
May 2022 – Second coldest May of the last 100 years
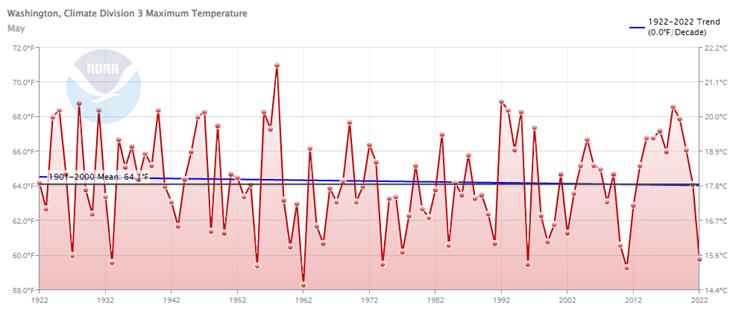
Puget Sound Lowlands
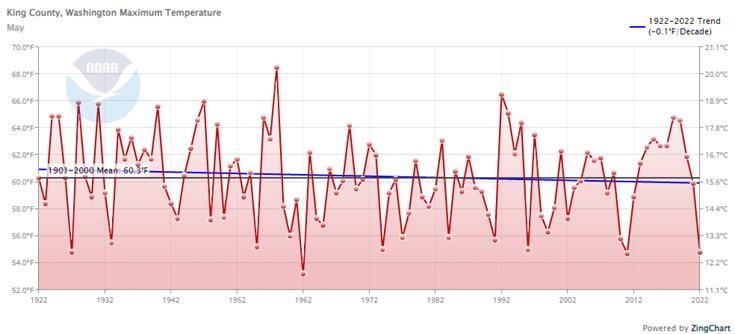
King County
May 2022 – Third coldest May of the last 100 years
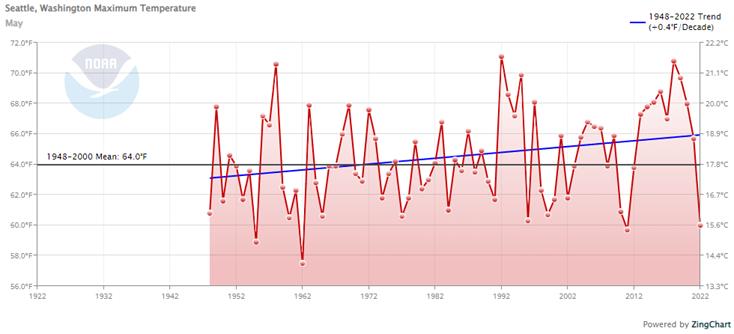
Seattle
Seattle - A HUGE warming trend! But why does Seattle data only start in 1948? That is when the SeaTac airport was built. Urban stations are excluded from climate data due to the Urban Heat Island (UHI) effect. But many urban airports suffer from similar poor urban siting for climate stations as well.
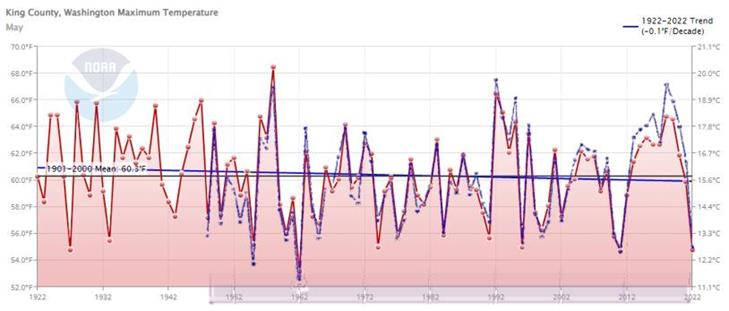
A large part of the warming trend in the Seattle data is due to the omission of earlier years with warmer Mays, as exhibited at every regional summary level, as shown in the graphs above. If we take the Seattle graph above, turn the red data line to blue and superimpose it on the King County graph shown previously we get the following:
The above shows that the Seattle +0.4 trend is due to foreshortened data. The warmer years of 1922 – 1947 were not part of the data.
The deviation of Seattle from the county data line shows the urban warming at the SeaTac airport, probably due to the massive transit (and other concrete-dependent) expansion around it over the last 20 years.
|
|
|
|
Conclusion
For the last 100 years, the May maximum temperature has not been increasing in the Pacific Northwest. CO2 just does not work its magical warming during the month of May.
Since H2O is the main greenhouse gas, a bit of additional CO2 can’t do anything in that type of climate. For more about why CO2 cannot cause warming in climates that have abundant water vapor, see: http://appinsys.com/GlobalWarming/GW_Basics.htm
For more about Washington State:
http://appinsys.com/GlobalWarming/SeattleSummer.htm - Seattle summers are not warming
http://appinsys.com/GlobalWarming/WA_Puget.htm - Puget Sound Sea Level
http://appinsys.com/GlobalWarming/PugetSound.htm - Pacific Decadal Oscillation drives the temperature, not CO2
http://appinsys.com/GlobalWarming/WA_State_Lies.htm - WA fires and temperatures
http://appinsys.com/GlobalWarming/InsleesBillions.htm - Inslee blames oyster problems on “climate change”
|
|
NOAA data on monthly average maximum temperature shown in the graphs above: It is not the max temperature recorded in the month. It is the average of the maximum temperature recorded each day of the month.
|
|
|