Global Warming Science: www.appinsys.com/GlobalWarming
Mississippi: No Warming, Guardian Fake News
[last update: 2019/04/19]
|
The Guardian – Climate Fake News Maker
https://www.theguardian.com/environment/2019/apr/18/climate-change-mississippi-plantation-economy
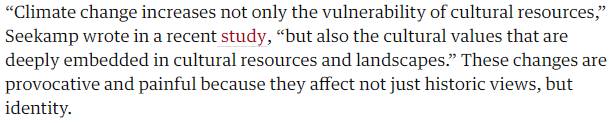
The magic molecule, CO2, causes increase of cultural values:
|
|
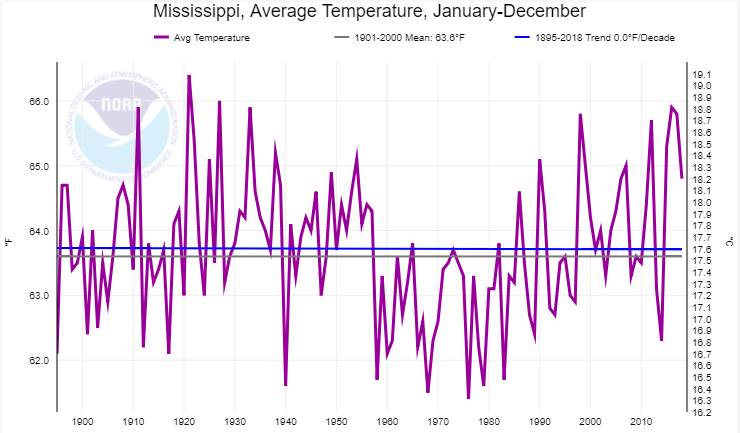
Mississippi Climate Data
Average temperature – no long term trend. Hottest decades were 1920s / 30s
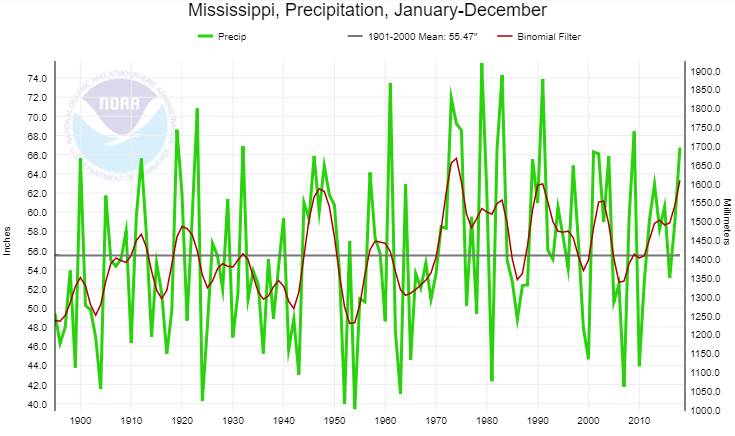
(Plots generated https://www.ncdc.noaa.gov/cag/statewide/time-series)
Precipitation – no statistically significant trend (slight long term increase):
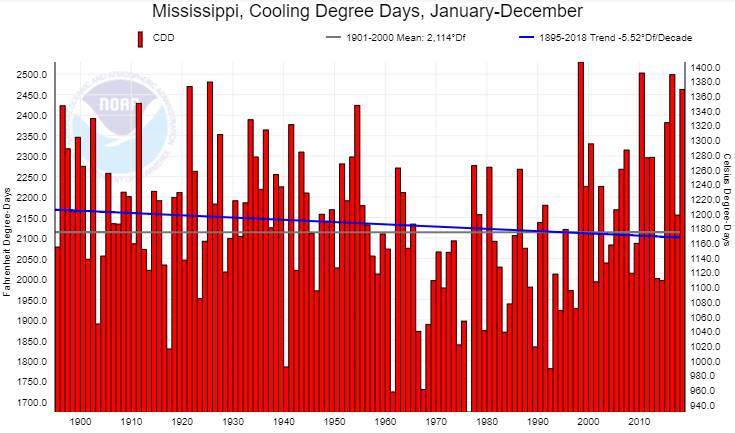
Cooling degree-days – no statistically significant trend (slight long term decrease):
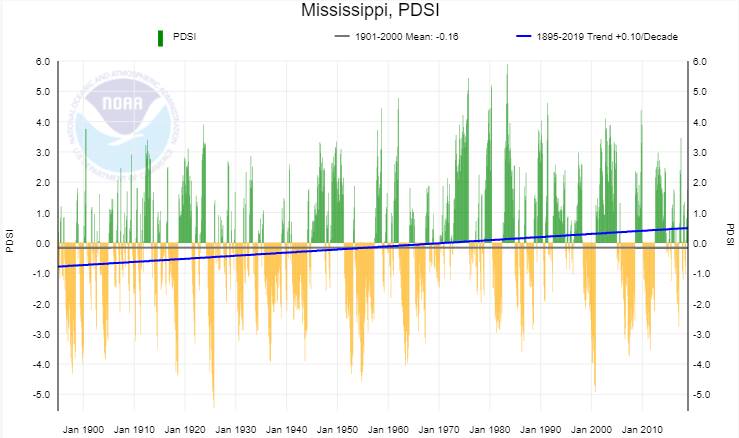
Drought – no statistically significant trend (slight long term decrease in drought):
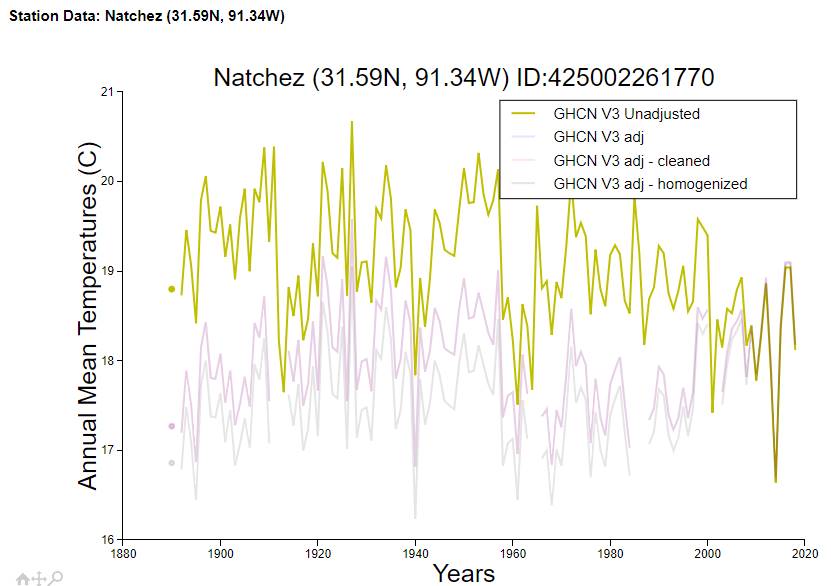
The Guardian author refers to Natchez – here is the temperature data from the NASA GHCN station. The actual data show a long term cooling.
https://data.giss.nasa.gov/cgi-bin/gistemp/stdata_show.cgi?id=425002261770&dt=1&ds=7
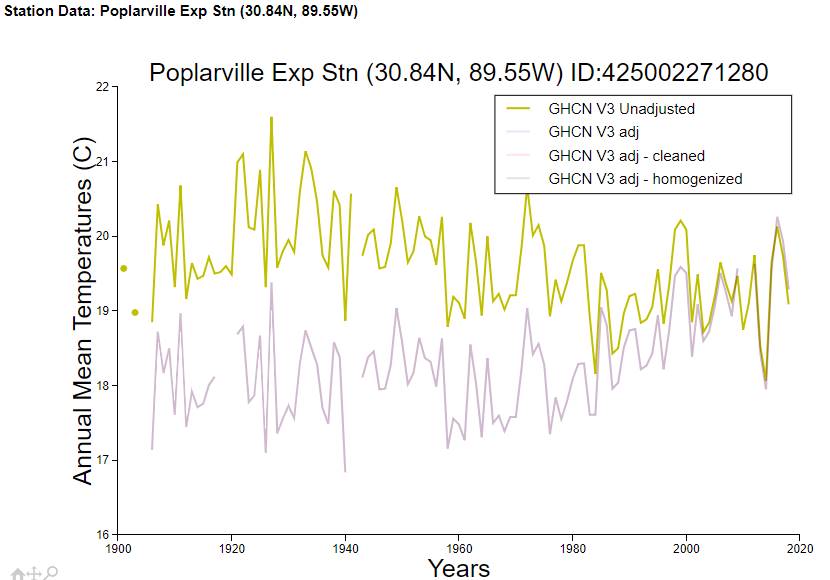
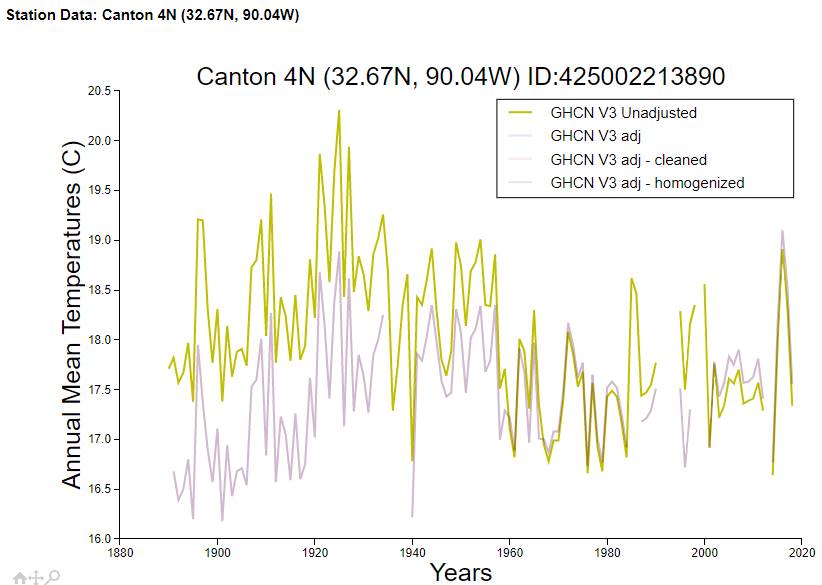
Other locations in Mississippi:
Note that in the above station plots, all unadjusted data show long term cooling trends. But NASA adjusts each one to produce a warming trend.
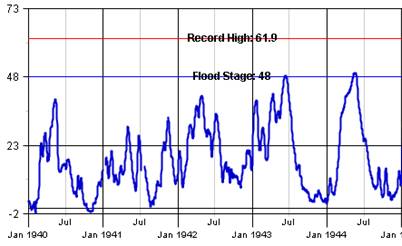
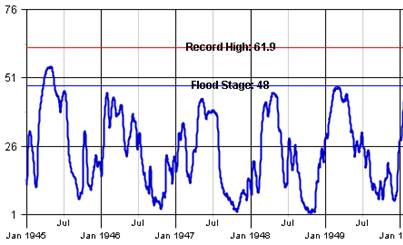
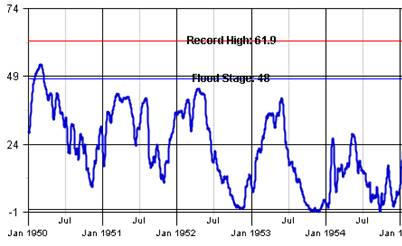
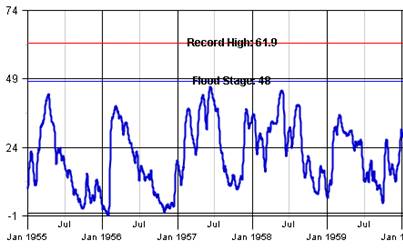
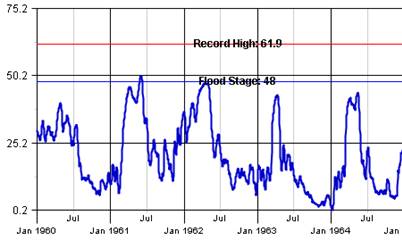
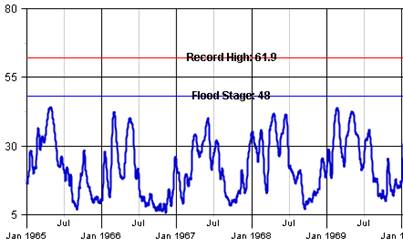
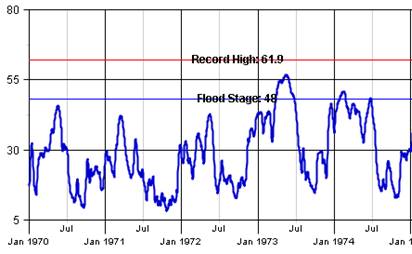
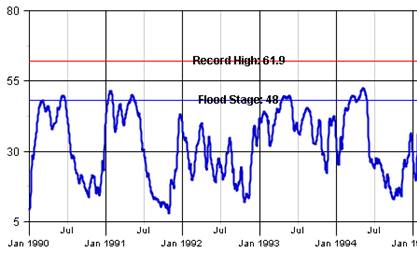
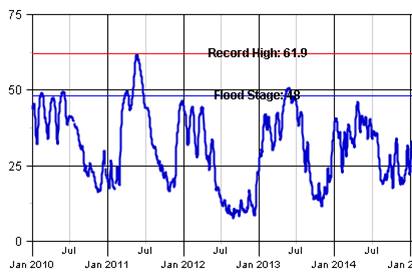
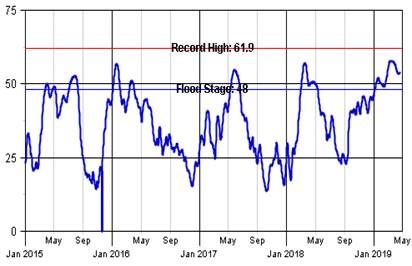
Mississippi river levels at Natchez can be plotted at: The data starts in the 1940s so it doesn’t cover the hottest decades in MS – the 1920s and 30s (and the old record of 1937) The current record was set in 2011 slightly breaking the previous set in 1937. The following figures from the above link show the river level within each decade.
1940s
1950s
1960s
1970s
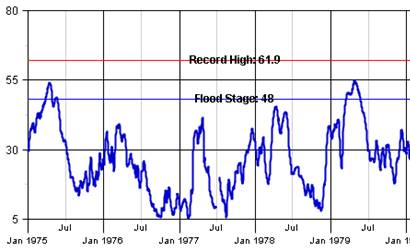
1980s
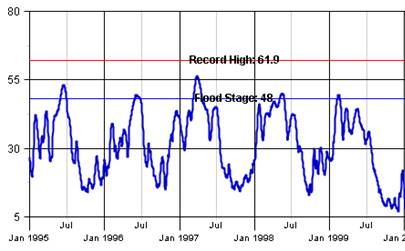
1990s
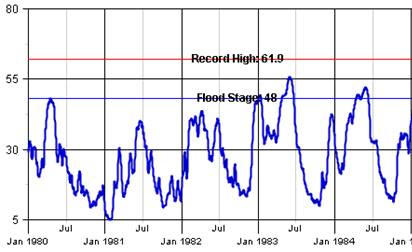
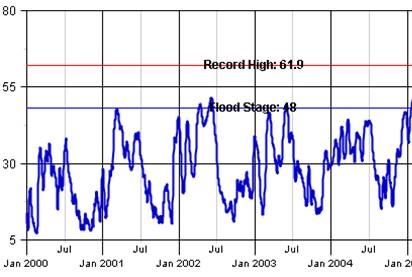
2000s
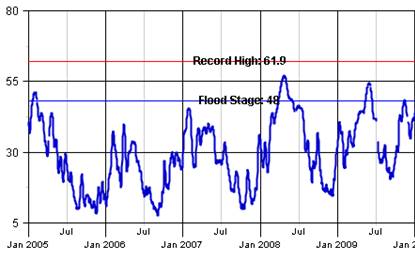
2010s
A study of the effects of El Nino on Mississippi flooding states: “the two largest historical floods of the lower Mississippi River in the springs of 1927 and 2011 were preceded by El Niño events in the winters of 1925/1926 and 2009/2010, respectively. More moderate floods, including those in springs of 1973 and 1983, were preceded by El Niño events in the winters of 1972/1973 and 1982/1983, respectively. Of all 14 major Mississippi River floods observed at Vicksburg, Mississippi (defined as peak annual stage >15.24 m) from 1858–2015, 64% have occurred within a year of an El Niño event ” https://www.nature.com/articles/s41598-017-01919-6
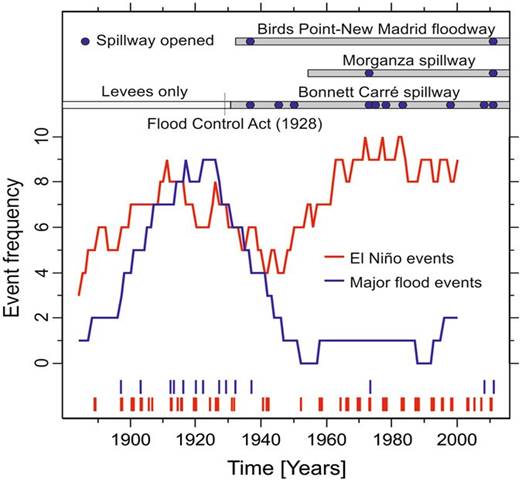
The following figure from the above referenced study shows “The frequency of historical El Niño events (red) and major Mississippi River floods at Vicksburg, Mississippi (blue) since the late 19th century to present in relation to river engineering along the lower Mississippi River. Event frequencies calculated as the number of events within a moving 30-year window. ”
The above study states: “Our findings – implying that ENSO variability plays an important role in the development of floods on the lower Mississippi River – are generally consistent with historical observations ([figure above]). Prior to the mid-20thcentury when flood control consisted mainly of artificial levees along the main channel, the frequency of major floods at Vicksburg, Mississippi closely tracks the frequency of El Niño events. This relationship has apparently broken down since the mid-20th century, when only three floods – in 1973, 2008, and 2011 – have attained major flood stage despite an increase in the frequency of El Niño events at this time. The timing of this shift in the relationship between flood stages and ENSO variability follows the establishment of the lower Mississippi’s modern flood control system as well as an intensification of other anthropogenic changes to the land surface and hydrology of the Mississippi River basin, that are not included in the CESM-LME simulations. The modern flood control system includes an artificially shortened and straightened main channel held in place by concrete revetments, and a series of spillway structures that can be opened during times of high discharge to relieve pressure on levees that together have altered the relationship between river stage and discharge during the 20th century. The spillway structures have, however, been opened more often during periods of increased El Niño event frequency (e.g., 1970–1985), indicating that ENSO continues to shape inter-annual variability of the lower Mississippi’s discharge despite the strong influence of human activities on the river’s recent behavior.”
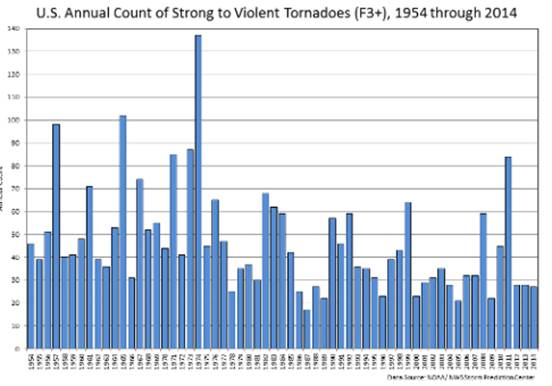
Tornados have been declining (couldn’t find trends by state).
https://www.ncdc.noaa.gov/climate-information/extreme-events/us-tornado-climatology/trends
|
|
Conclusion
The Guardian wonders why people in Mississippi don’t care about the CO2 boogeyman. If they bothered to look at the actual climate data, they would understand why.
(The Guardian author thinks it is due to: “Like much of the south, it’s a layered place with a diverse constituency and old wounds. There are artists, outdoors enthusiasts, academics and activists interspersed with those still clinging to old Dixie.”)
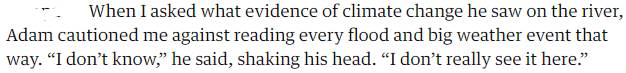
The Guardian author should listen to her Mississippi river guide:
The Guardian is known for concocting fake climate change stories. See: http://appinsys.com/GlobalWarming/FloridaUpdate.htm
|
|
|