Global Warming Science - www.appinsys.com/GlobalWarming
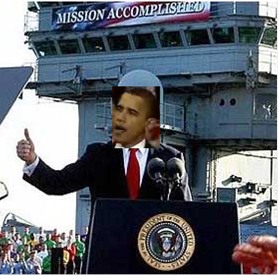
Mission Accomplished!
[last update: 2012/09/10]
|
Obama Declares the Turning Point
Obama declared in 2009: “America, this is our moment … that I am absolutely certain that generations from now, we will be able to look back and tell our children that this was the moment when the rise of the oceans began to slow and our planet began to heal”
Now Obama is running for his second term. This document examines his record in achieving his climate goals.
|
|
Sea Level
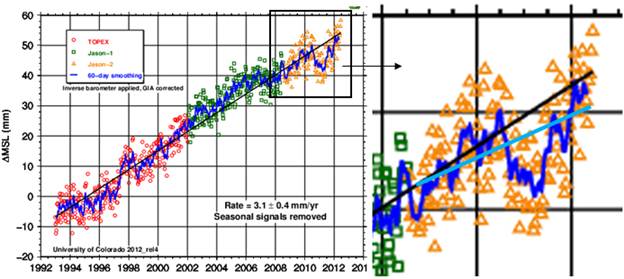
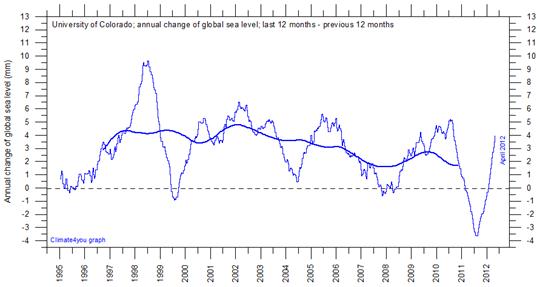
The following figure shows the change in global mean sea level since satellite sea level data collection began [http://sealevel.colorado.edu/]
The global rate of sea level rise has declined since Obama took office – success!
|
|
CO2 Emissions
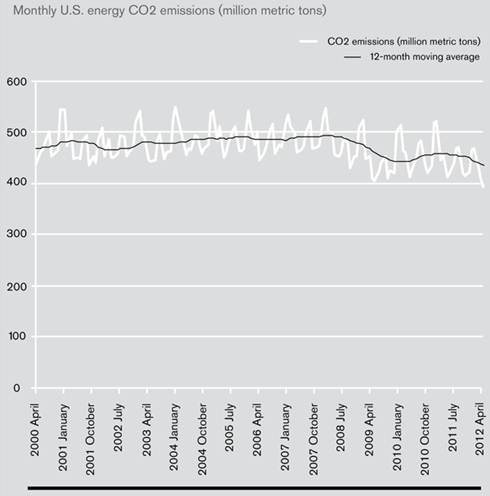
The following figure shows monthly U.S. CO2 emissions since 2000. The article states “the country emitted the smallest amount of energy-related carbon dioxide in a January-to-March stretch since 1992, according to a report out this month from the U.S. Energy Information Administration.” [http://www.technologyreview.com/news/428947/a-drop-in-us-co2-emissions/ ]
The U.S. CO2 emissions have declined since Obama took office – success!
|
|
Temperature
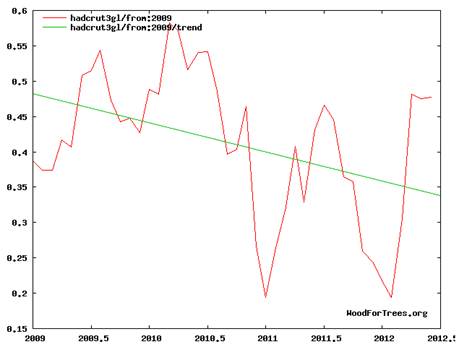
The following figure shows the HadCruT 3 Unadjusted Global Mean Temperature since 2009. [http://www.woodfortrees.org/plot/hadcrut3gl/from:2009/plot/hadcrut3gl/from:2009/trend]
The global average temperature has declined since Obama took office – success!
|
|
Conclusion
Obama has helped stop global warming… Mission Accomplished!
(based on http://en.wikipedia.org/wiki/File:Bush_mission_accomplished.jpg)
(OK, the global warming show is over – everyone move along.)
|
|
|
|
Caveats
Did Obama really accomplish this?
Sea Level
The following figure shows declining rate of change of sea level since during the era of George Bush.
CO2 Emissions
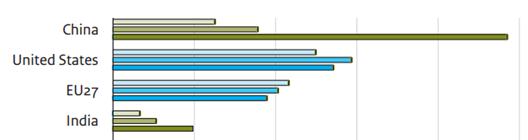
U.S. CO2 emissions began declining before Obama took over, while China’s CO2 emissions are increasing exponentially. The following figure shows CO2 emissions by country.
[http://edgar.jrc.ec.europa.eu/CO2REPORT2012.pdf]
“U.S. emissions started going down in 2005 and are expected to decline further over the next decade, while Europe's cap and trade system has had no measurable impact on emissions.” [http://www.newgeography.com/content/002786-why-emissions-are-declining-us-but-not-europe] So perhaps George Bush deserves the credit.
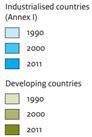
Temperature
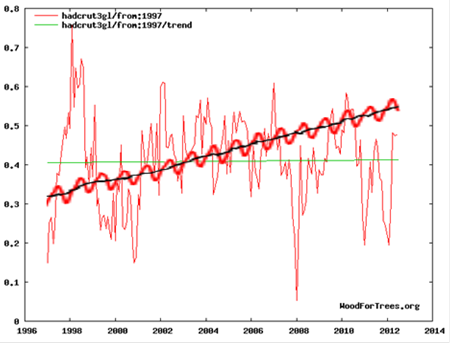
There has been no increase in the global temperature trend over the last 15 years. The current decline started in 2002, so perhaps George Bush should get the credit.
CO2 / Temperature
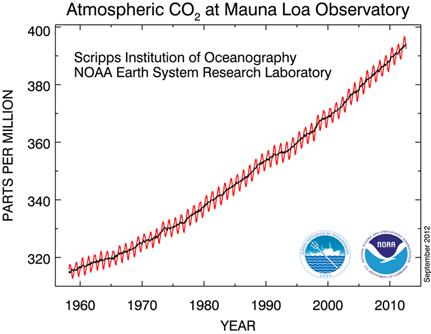
The following figure shows the CO2 at Mauna Loa [http://www.esrl.noaa.gov/gmd/ccgg/trends/]
The following figure combines the previous two figures. CO2 rate goes up, temperature trend is flat (zero trend).
According to NOAA 2008 State of the Climate report, regarding climate models (which are based on CO2 for driving the warming): “Near-zero and even negative trends are common for intervals of a decade or less in the simulations, due to the model’s internal climate variability. The simulations rule out (at the 95% level) zero trends for intervals of 15 yr or more, suggesting that an observed absence of warming of this duration is needed to create a discrepancy with the expected present-day warming rate.” [http://www1.ncdc.noaa.gov/pub/data/cmb/bams-sotc/climate-assessment-2008-lo-rez.pdf] In other words, the current observed period of 15 years with no warming invalidates the climate models, and thus the influence of CO2 on climate is over-guesstimated.
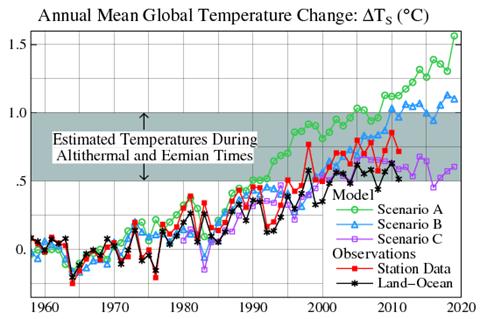
The following figure compares the observed global temperature with James Hansen’s climate model predictions used to start the global warming scare in 1988. The observations most closely match scenario C (which had reduced CO2 emissions rate from 1988 levels into the future “such that the greenhouse gas climate forcing ceases to increase after 2000” – see http://www.appinsys.com/GlobalWarming/HansenModel.htm for more info on Hansen’s models). Scenario A is the only scenario with an increasing rate of CO2 in the graph below.
Figure from: [http://www.columbia.edu/~mhs119/Temperature/T_moreFigs/]
Since the only evidence for an influence of anthropogenic CO2 on climate is based on computer models (see http://www.appinsys.com/GlobalWarming/NatureRag.htm), and the current trends have now invalidated the models, it is time to investigate actual climatic factors instead of the political CO2 bogeyman.
|
|
Obama 2012
At the Democratic National Convention, Obama said: “my plan will continue to reduce the carbon pollution that is heating our planet – because climate change is not a hoax. More droughts and floods and wildfires are not a joke. They’re a threat to our children’s future. And in this election, you can do something about it. ”
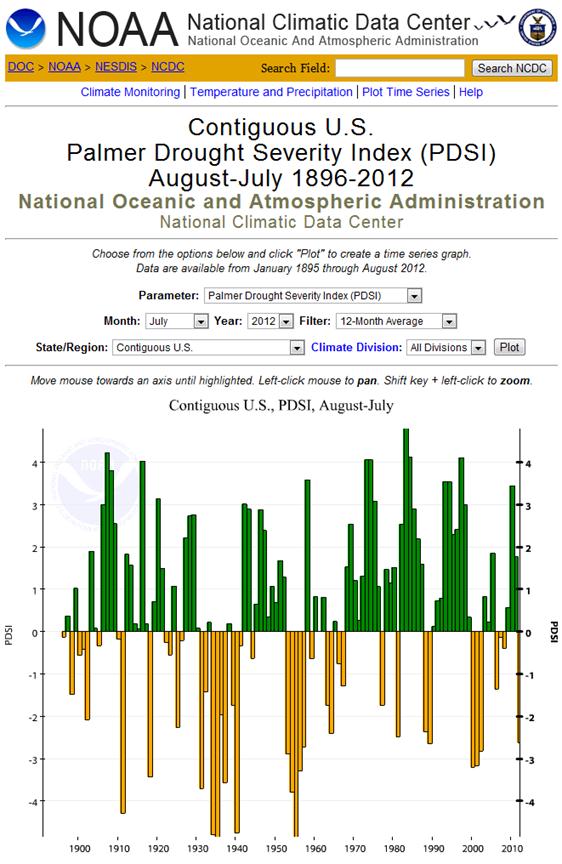
So he’s not bright enough to know he already accomplished the mission. He doesn’t even know that droughts have been declining since 2000 (although 2012 has the most severe drought since 2002). The following figure shows the Palmer Drought Severity Index (PDSI) – the drought is on the negative index side (yellow bars). http://www.ncdc.noaa.gov/temp-and-precip/time-series/index.php?parameter=pdsi&month=7&year=2012&filter=12&state=110&div=0
In 2009 Obama showed his profound ignorance of science “the polluters who currently emit the dangerous carbon emissions that contaminate the water we drink” (for the quote source, see the 6/23/2009 update in http://www.appinsys.com/GlobalWarming/ObamasGovernment.htm)
It’s no wonder Obama has strange ideas – his science advisor is John Holdren who co-authored population alarmist books and papers with Paul Ehrlich on the population bomb. “We are not, of course, optimistic about our chances of success. Some form of ecocatastrophe, if not thermonuclear war, seems almost certain to overtake us before the end of the century. (The inability to forecast exactly which one – whether plague, famine, the poisoning of the oceans, drastic climatic change, or some disaster entirely unforeseen – is hardly grounds for complacency.)” From an earlier book “Human Ecology”, also coauthored with the Ehrlichs (1973): “A massive campaign must be launched to restore a high-quality environment in North America and to de-develop the United States” [http://www.cnsnews.com/public/content/article.aspx?RsrcID=51702]
Perhaps politicians as a group do not generally exhibit much intelligence, but in the science debate Romney shows a little more sense: “President Obama has taken the view that if global warming is occurring, the American response must be to slash carbon dioxide emissions by imposing enormous costs on the U.S. economy. First he tried a massive cap-and-trade bill that would have devastated U.S. industry. When that approach was rejected by Congress, he declared his intention to pursue the same course on his own and proceeded through his EPA to impose rules that will bankrupt the coal industry. … China long ago passed America as the leading emitter of greenhouse gases. Developed world emissions have leveled off while developing world emissions continue to grow rapidly, and developing nations have no interest in accepting economic constraints to change that dynamic. In this context, the primary effect of unilateral action by the U.S. to impose costs on its own emissions will be to shift industrial activity overseas to nations whose industrial processes are more emissions-intensive and less environmentally friendly. That result may make environmentalists feel better, but it will not better the environment.” [http://www.sciencedebate.org/debate12/]
|
|
http://www.appinsys.com/obama/obama.htm
|
|
|
