Global Warming Science - www.appinsys.com/GlobalWarming
The Medieval Warm Period – AGW Nemesis and Red Herring
[last update: 2010/02/15]
|
The popular global warming theory: that anthropogenic CO2 emissions have caused unprecedented global warming in from 1970 – 1990s, is based strictly on the combination of two features:
If it the late 20th century warming can’t be shown to be unprecedented, then there is a major problem with the theory (there has been no warming since the 1990s, which is also becoming a problem for the theory).
|
|
Background
The IPCC went to considerable effort to provide evidence that the warming was unprecedented. The “hockey-stick” graph produced by Michael Mann (and used by the IPCC and Al Gore) eliminated the Medieval Warm Period and the Little Ice Age in order to exaggerate the 20th century warming. Thus the MWP is the nemesis of the AGW theory.
The IPCC position is at odds with the findings of many other scientists. For example, research at the Harvard-Smithsonian Center for Astrophysics report on a recent paper using proxies, which verifies the occurrence of the MWP: [http://cfa-www.harvard.edu/press/pr0310.html] “A review of more than 200 climate studies led by researchers at the Harvard-Smithsonian Center for Astrophysics has determined that the 20th century is neither the warmest century nor the century with the most extreme weather of the past 1000 years. The review also confirmed that the Medieval Warm Period of 800 to 1300 A.D. and the Little Ice Age of 1300 to 1900 A.D. were worldwide phenomena not limited to the European and North American continents. While 20th century temperatures are much higher than in the Little Ice Age period, many parts of the world show the medieval warmth to be greater than that of the 20th century.”
Dr. David Deming (University of Oklahoma, College of Earth and Energy) said in his testimony to congress [http://epw.senate.gov/hearing_statements.cfm?id=266543] “I had another interesting experience around the time my paper in Science was published. I received an astonishing email from a major researcher in the area of climate change. He said, "We have to get rid of the Medieval Warm Period.” The existence of the MWP had been recognized in the scientific literature for decades. But now it was a major embarrassment to those maintaining that the 20th century warming was truly anomalous.”
In the CRU emails:
Email from Jonathan Overpeck to Keith Briffa, 13 Sep 2006: [http://www.eastangliaemails.com/emails.php?eid=742&filename=1158153059.txt]
“I don't think our team feels it
is valid to say,
as they did in TAR, that "It is also likely that, in the Northern Hemisphere...
1998 was the warmest year" in the last 1000 years. But, it you
think about
Email from Michael Mann to Phil Jones and others, Jun 4, 2003, (Subject: “Prospective Eos Piece?” [http://www.eastangliaemails.com/emails.php?eid=319&filename=1054736277.txt]).
“it would be nice to try to
"contain" the putative "MWP", even if we don't yet
Email exchange between Keith Briffa and Edward Cook, Apr 12, 2005, (Subject: “Review” [http://www.anelegantchaos.org/cru/emails.php?eid=310&filename=1051638938.txt]).
Cook to
Briffa: “as one is honest
and open about evaluating the evidence (I have my doubts I just don't want to get into
an open critique
Briffa to
Cook: “Bradley still
regards the MWP as "mysterious" and "very incoherent"
(his latest
|
|
The Red-Herring – Globality of the MWP
In February 2010, Phil Jones (who is in charge of the data at the University of East Anglia Climatic Research Unit – CRU) had an interview with the BBC [http://news.bbc.co.uk/2/hi/science/nature/8511670.stm]
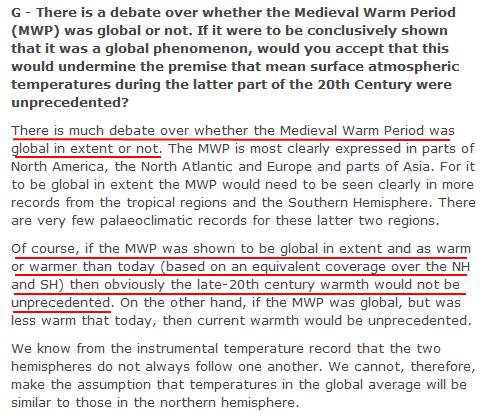
His response to question G indicates the red-herring that the AGW promoters try to use:
The crucial points: “if the MWP was shown to be global in extent and as warm or warmer than today (based on an equivalent coverage over the NH and SH) then obviously the late-20th century warmth would not be unprecedented.”
The as warm as today part has been demonstrated by various researchers (see: http://www.appinsys.com/GlobalWarming/GW_Part1_PreHistoricalRecord.htm#mwp)
This is also shown in various CRU emails – for example:
Email: Keith Briffa to Michael Mann, Jones and others, Sep 22, 1999, (Subject: “IPCC Revisions” [http://www.eastangliaemails.com/emails.php?eid=136&filename=938018124.txt])
“I believe that the recent warmth was probably matched about 1000 years ago”
Email: Raymond Bradley to Frank Oldfield, Jul 10, 2000, (Subject: “IPCC Revisions” ” [http://www.eastangliaemails.com/emails.php?eid=172&filename=963233839.txt]).
“Whether we have the 1000 year trend right is far less certain (& one
reason why I hedge my bets on
The red-herring: the MWP was not global, therefore it doesn’t count.
The problem: the warming of the “official” CO2 era (1970s-1990s) was not global either.
Recent Global? Warming
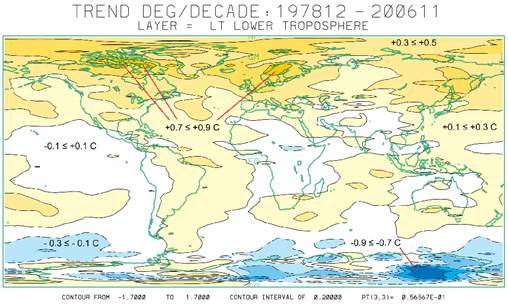
Global warming is not global. The following figure shows the global temperature change from 1978 to 2006 for the lower troposphere from UAH satellite data [http://climate.uah.edu/25yearbig.jpg]. The warming is a northern hemisphere phenomenon – particularly in the Arctic.
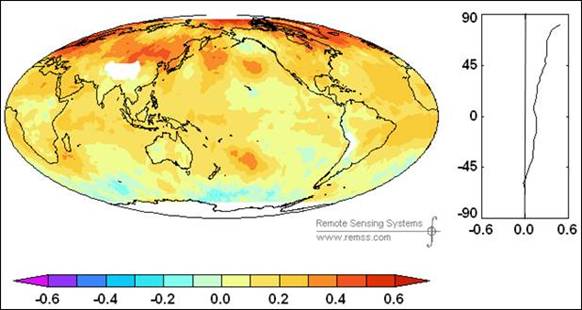
The following figure shows a more recent satellite data trend from the RSS analysis 1979 - 2008 [http://www.ssmi.com/msu/msu_data_description.html]. The left-hand figure shows regional warming around the world, the right-hand figure shows the average warming by latitude – zero warming at 60 degrees S with increasing warming into the Arctic. This illustrates that recent warming is a northern hemisphere phenomenon.
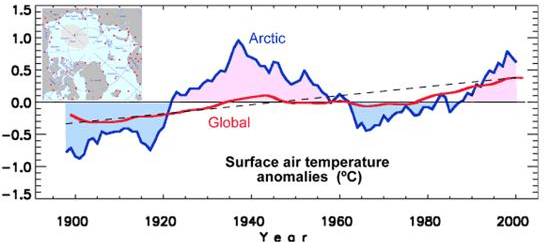
The following figure compares the Arctic temperature trends with global temperature trends.[http://www.frontier.iarc.uaf.edu/~igor/research/aw/index.php] Two observations are evident from this graph: the recent Arctic warming is not unprecedented, and the Arctic warming is much greater than the global warming.
The following figure is from the IPCC Fourth Assessment Report (AR4) Figure 9.6 (2007). It shows the change in temperature (C per decade) by latitude. The black line shows the observed temperature, the blue band shows the output of the computer models including only natural factors, whereas the pink band shows the output of computer models including anthropogenic CO2. Notice that the models without CO2 (blue shaded area) can explain all of the warming for most of the world up to 30 degrees north latitude. This figure also shows cooling in Antarctica with warming increasing in the Arctic.
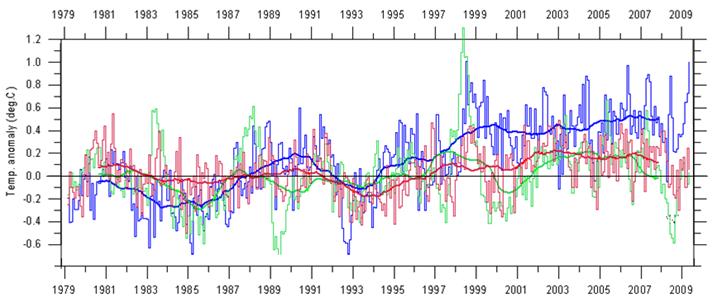
The following figure shows the average lower troposphere temperature (near the Earth’s surface) from satellite data, for the northern hemisphere (north of 20N), tropics (20N – 20S) and southern hemisphere (south of 20S) (figure adapted from http://climate4you.com/). The northern hemisphere has warmed about 0.5 degrees C, while the southern hemisphere has warmed about 0.1 C and the tropics show no net warming over the 30 years of available satellite data.
See http://www.appinsys.com/GlobalWarming/GW_NotGlobal.htm for more details on the non-global issue.
|
|
No Direct Evidence of AGW
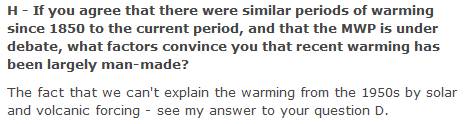
In the Phil Jones – BBC interview noted above ([http://news.bbc.co.uk/2/hi/science/nature/8511670.stm]) question H is also revealing:
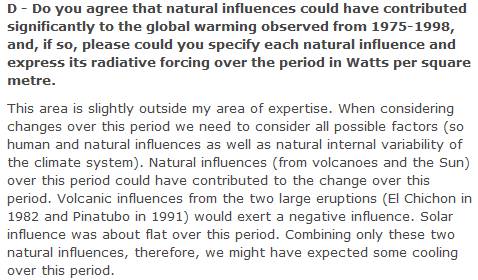
Jones refers to question D:
The critical point is that there is no empirical evidence for anthropogenic CO2 as a causative factor: simply “we can’t explain the warming from the 1950s by solar and volcanic forcing”. We can’t explain it – so it must be CO2.
A blatant lack of direct evidence does not suffice in many areas of science.
But it does match the statements of the journal “Nature” - “Denialists often maintain that these changes are just a symptom of natural climate variability. But when climate modellers test this assertion by running their simulations with greenhouse gases such as carbon dioxide held fixed, the results bear little resemblance to the observed warming. The strong implication is that increased greenhouse-gas emissions have played an important part in recent warming, meaning that curbing the world's voracious appetite for carbon is essential”.
Or incomplete models.
See: http://www.appinsys.com/globalwarming/NatureRag.htm for more details on this.
|
|
|