Global Warming Science: www.appinsys.com/GlobalWarming
US Climate Emergency
[last update: 2019/06/26]
|
Emergency
“We are working to compel governments in the United States and throughout the world to declare Climate Emergency”
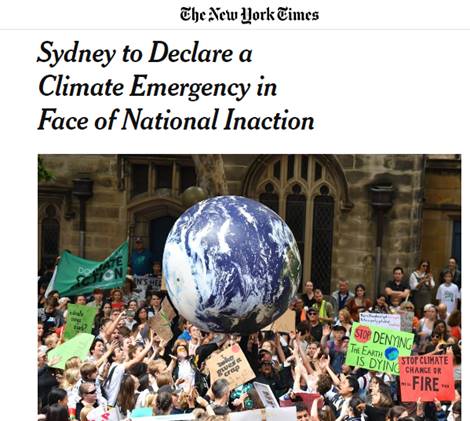
https://www.nytimes.com/2019/06/21/world/australia/sydney-climate-emergency.html According to the New York Times: “Federal action has been similarly lacking in the United States, where President Trump has called climate change a hoax and moved to withdraw the country from the Paris climate accord. In that void, state and local governments have taken up the mantle of action, with lawmakers in New York State this week approving a plan to virtually eliminate carbon emissions by 2050. New York joined a half dozen Western states like California in setting a goal of a carbon-free future.”
|
|
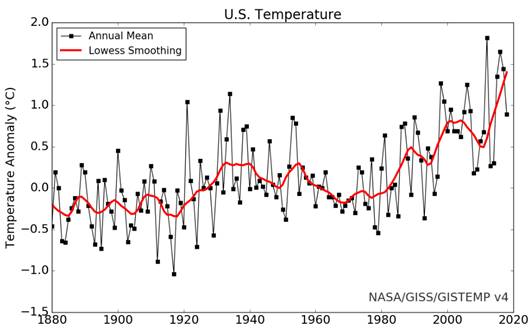
US Temperature
The following graph shows the most recent NASA version of the US annual average temperature record through 2018.
https://data.giss.nasa.gov/gistemp/graphs_v4/graph_data/U.S._Temperature/graph.png
What happened in the past couple of decades?
A 1989 New York Times article: [http://www.nytimes.com/1989/02/04/us/global-warmth-in-88-is-found-to-set-a-record.html] “Last week, scientists from the United States Commerce Department's National Oceanic and Atmospheric Administration said that a study of temperature readings for the contiguous 48 states over the last century showed there had been no significant change in average temperature over that period. Dr. Jones said in a telephone interview today that his own results for the 48 states agreed with those findings. But he said there was no inconsistency between the apparent stable trend in the United States and the rise in global temperature because the 48 states cover a very small fraction of the earth's surface and there are bound to be regional variations in climate.”
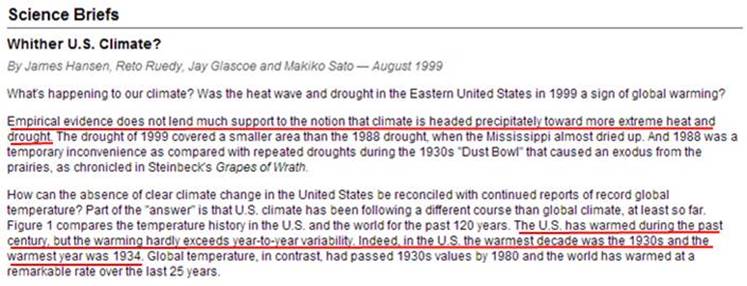
A 1999 NASA report:
[http://www.giss.nasa.gov/research/briefs/hansen_07/]
The same 1999 NASA report also states: “in the U.S. there has been little temperature change in the past 50 years, the time of rapidly increasing greenhouse gases — in fact, there was a slight cooling throughout much of the country ”
So how did this non-warming in the US by 1999 become such an increase over the recent decades? The U.S. temperatures are based on an ever-increasing adjustment of historical data to produce warming.
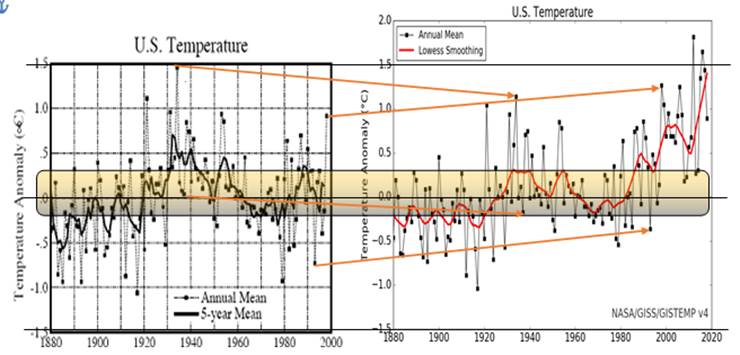
The following graphs show the historical US data from the GISS database as published in 1999 and 2001. Left graph – produced in 1999 (Hansen et al 1999 [http://pubs.giss.nasa.gov/docs/1999/1999_Hansen_etal.pdf]) Right graph – produced in 2000 (Hansen et al 2001 [http://pubs.giss.nasa.gov/docs/2001/2001_Hansen_etal.pdf]). They are from the same raw data – the only difference is that the adjustment method was changed by NASA in 2000.
U.S. Temperature Changes Due to Change in Adjustment Methods (Left: 1999, Right 2001)
The following figure compares the above graph from 1999 with the 2019 v4 graph shown previously. This shows how an increase in temperature trend was achieved simply by changing the method of adjusting the data. Temperatures were reduced in the 1930s and increased in the 1980s and 1990s as indicated by the orange arrows. Formerly 1934 was the warmest year and then – presto – suddenly 1998 was the warmest pre-2000 year. The 1930s warm period is slowly being erased with each new revision.
The daily temperatures have become less extreme in recent decades – coldest temperatures are warming while the hottest are cooling. The US government Climate Science Special Report (2017) provides the following information. https://science2017.globalchange.gov/chapter/6/
“the warmest daily temperature of the year increased in some parts of the West over the past century (Figure 6.3 [shown below]), but there were decreases in almost all locations east of the Rocky Mountains. In fact, all eastern regions experienced a net decrease”
[Figure 6.3] “Observed changes in the coldest and warmest daily temperatures (°F) of the year in the contiguous United States. Maps (top) depict changes at stations; changes are the difference between the average for present-day (1986–2016) and the average for the first half of the last century (1901–1960). Time series (bottom) depict the area-weighted average for the contiguous United States. Estimates are derived from long-term stations with minimal missing data in the Global Historical Climatology Network–Daily dataset.”
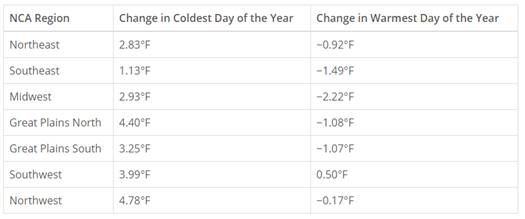
The report provides the following table showing the changes in extreme temperatures by region. The coldest days are warming and the hottest days are cooling. Thus the temperatures are becoming less extreme.
The coldest days have warmed more than the hottest days have cooled, resulting in a net average temperature increase. This shows how the average can be misleading. The average shows warming and this is portrayed in the media as the country is heating up. But inreality, the coldest days aren’t as cold and the hottest days aren’t as hot.
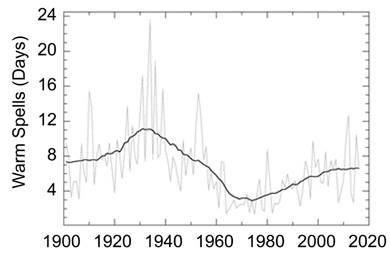
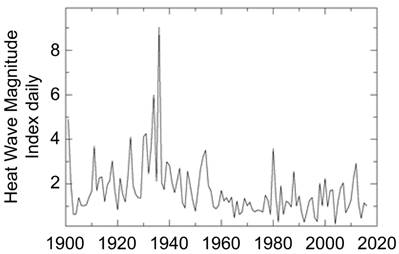
From the same CSSR report, the following figures show that while warm spells and heat wave magnitude have increase recently, they are still well below the first half of the 1900s.
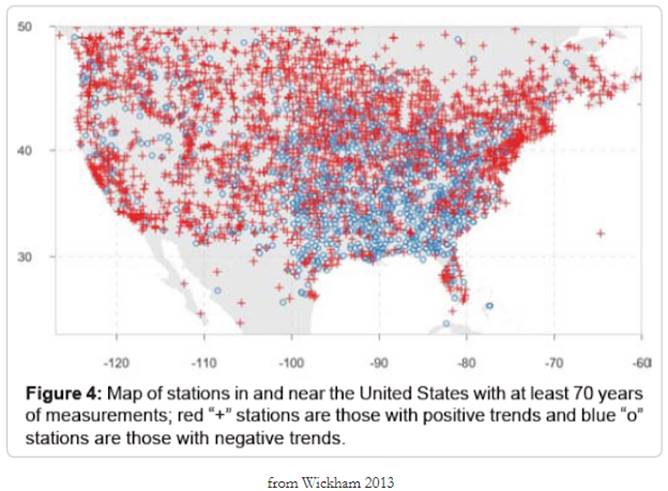
There are a significant number of stations that exhibit long term cooling trends, as shown in the following figure. http://perhapsallnatural.blogspot.com/2019/05/our-urban-climate-crisis_15.html
But the stations get adjusted to keep with the global warming narrative.
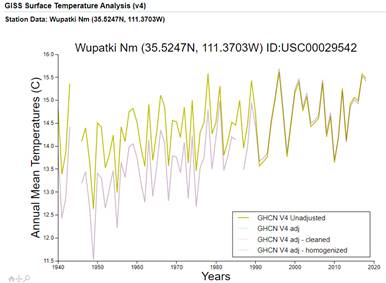
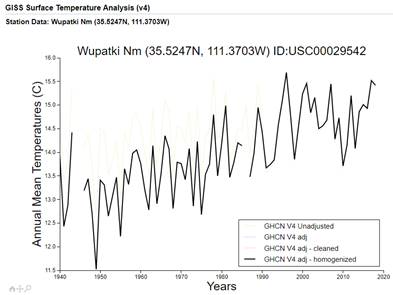
Temperature station data can be plotted at: https://data.giss.nasa.gov/gistemp/station_data_v4_globe/ The following figures show an example of the adjustments made to the data – unadjusted (left) and “homogenized” (right). This is a rural station at Wupatki National Monument AZ. NASA has exaggerated the warming through their adjustments.
|
|
Hurricanes, Tornadoes, Drought
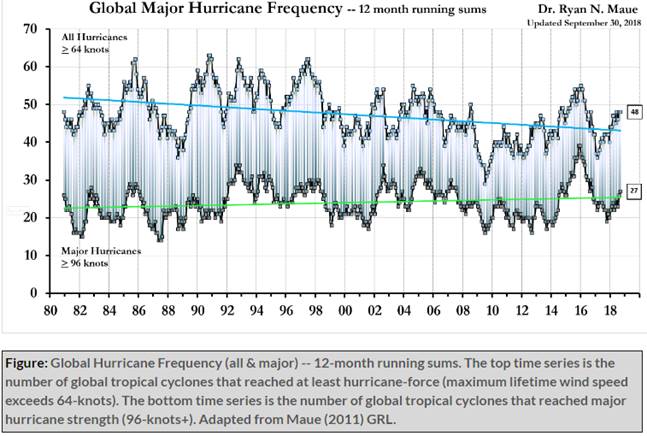
Hurricanes “Tropical cyclone accumulated cyclone energy (ACE) has exhibited strikingly large global interannual variability during the past 40-years. In the pentad since 2006, Northern Hemisphere and global tropical cyclone ACE has decreased dramatically to the lowest levels since the late 1970s. Additionally, the frequency of tropical cyclones has reached a historical low. ” http://www.policlimate.com/tropical/
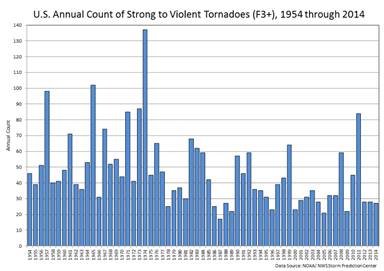
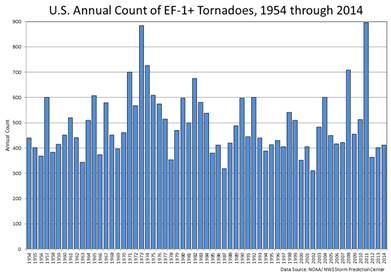
Tornadoes “With increased National Doppler radar coverage, increasing population, and greater attention to tornado reporting, there has been an increase in the number of tornado reports over the past several decades. This can create a misleading appearance of an increasing trend in tornado frequency. To better understand the variability and trend in tornado frequency in the United States, the total number of EF-1 and stronger, as well as strong to violent tornadoes (EF-3 to EF-5 category on the Enhanced Fujita scale) can be analyzed. These tornadoes would have likely been reported even during the decades before Doppler radar use became widespread and practices resulted in increasing tornado reports. The bar charts below indicate there has been little trend in the frequency of the stronger tornadoes over the past 55 years.” https://www.ncdc.noaa.gov/climate-information/extreme-events/us-tornado-climatology/trends
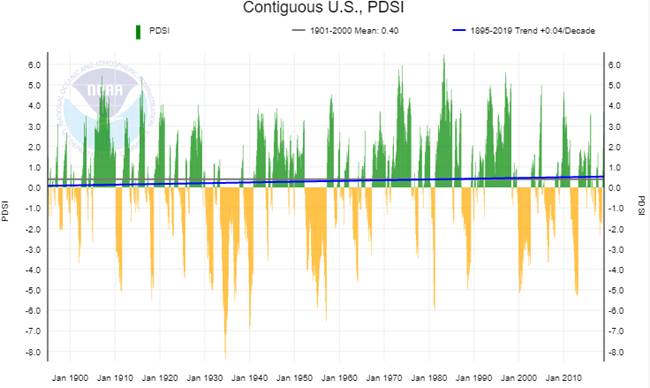
Drought “Average drought conditions across the nation have varied since records began in 1895. The 1930s and 1950s saw the most widespread droughts, while the last 50 years have generally been wetter than average ” https://www.epa.gov/climate-indicators/climate-change-indicators-drought
Drought extremes have been declining in recent decades as shown by the PDSI – but there is no long term trend. Palmer Drought Severity Index (PDSI) https://www.ncdc.noaa.gov/cag/national/time-series/
|
|
Conclusion There is no climate emergency.
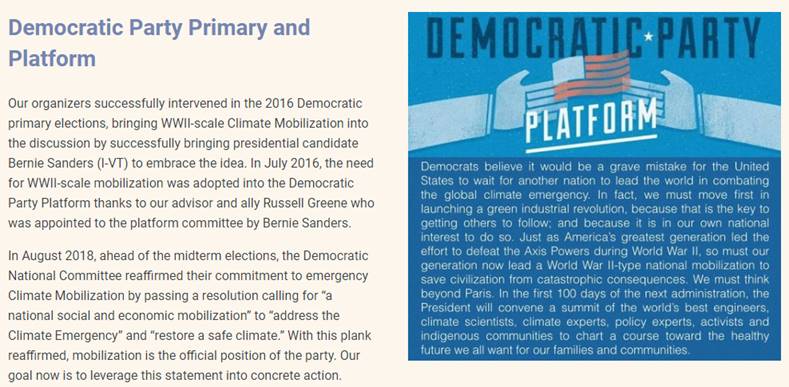
But the Democratic Party endorses it as proposed by the “The Climate Mobilization”: “In August 2018, ahead of the midterm elections, the Democratic National Committee reaffirmed their commitment to emergency Climate Mobilization by passing a resolution calling for “a national social and economic mobilization” to “address the Climate Emergency” and “restore a safe climate.” With this plank reaffirmed, mobilization is the official position of the party.” https://www.theclimatemobilization.org/overview-and-team
Unfortunately the Democrats want to do just that.
|


|
|