The Eelpout – Global Warming Takes Its Toll ?
The eelpout (Zoarces viviparus) became a fish of focus after New Scientist’s attack on David Bellamy (“Why Would A Botanist Deny Climate Change” – Oct. 2008) for writing a letter to them saying they are neglecting the many glaciers in the world that are growing [http://www.newscientist.com/blogs/shortsharpscience/2008/10/why-would-a-botanist-deny-clim.html]. David Bellamy, a long-time wildlife supporter and TV-wildlife promoter, was unable to continue as president of wildlife groups as a result of his views. See: “Wildlife groups axe Bellamy as global warming ‘heretic’” [http://www.timesonline.co.uk/tol/news/uk/article522744.ece]: “The television presenter and conservationist is the president of Plantlife International and of the Royal Society of Wildlife Trusts. Both organisations have given warnings that wildlife faces a catastrophe because of global warming. They have been acutely embarrassed to discover that while they have been campaigning to raise awareness, their president has been leading seminars and writing articles in science magazines declaring that man-made warming is a myth.”
The pro-alarmist New Scientist magazine cited Bellamy’s typos etc. and states that the effects of global warming have been “directly proven in some cases”, with a link to the following: “Chilled out Baltic Fish Feel the Heat” [http://environment.newscientist.com/channel/earth/dn10887-chilled-out-baltic-fish-feel-the-heat.html]. The linked article is about Hans Portner’s studies of the eelpout (Zoarces viviparus) and states: “A direct link between rising sea temperatures and a declining fish population has been established for the first time. The decade-long study of a North Sea fish species shows how small ocean temperature changes can drastically affect a marine organism’s oxygen supply. Used to a chilly environment, the fish exist within a narrow band of sea temperatures. … in the summer of 1997 sea temperatures reached 23°C, and the population dropped from four fish per kilometre squared to below one. … Over the past four decades, sea temperatures in the part of the North Sea studied have risen by about 1°C” (Unbelievable – a change of 1 degree kills the fish! ... 4 fish per km2 down to less than 1 fish per km2 … 4 fish per km2 – the study area must be where there are not very many eelpouts to begin with - let’s examine why that is.)
The eelpout is a northern European near-shore bottom fish with the distribution as shown in the following figure [http://www.fishbase.org/Summary/SpeciesSummary.php?id=479]
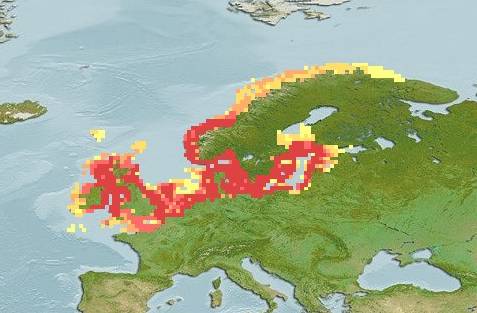
Distribution of Eelpout Zoarces viviparus
The eelpout has been studied quite extensively. One study -- “In situ Investigations on the Respiration and Behaviour of the Eelpout Zoarces Viviparous Under Short-term Hypoxia” (Fischer, Rademacher, Kils -- Marine Ecology Progress Series, 1992 [http://www.int-res.com/articles/meps/88/m088p181.pdf]): states: “Oxygen depletion in the coastal waters of the Western Baltic has recently become more frequent, mainly in the late summer months, when strong south-westerly winds cause upwelling of oxygen-free deep water, oxygen saturation in the shallows of the fjords drops from 100 to 0 % saturation in less than 1 hour. During such an event, on the night of 24 October 1987, more than 400 000 fish suffocated within a few hours in Eckernforder Bight (Western Baltic). Most of them were found washed ashore or floating in less than 1 m water with spread operculae, typical for death caused by asphyxiation. The most affected fish species were the benthic eelpout Zoarces viviparus L. and the seabull Myoxocephalus scorpius which accounted for more than 95 % of the dead fish biomass (Kils et al. 1989).
The same study also states: “eelpouts were able to take up oxygen from the water even at saturation levels below 5 %. Many other fish species are only capable of taking up oxygen at saturations levels above 20 to 40 % … However, field observation in the Western Baltic show that eelpouts are amongst the most affected species when oxygen depletion continues for longer period“
The “new scientist” Hans Portner was involved with an earlier study of the eelpout (“Physiological Disturbances at Critically High Temperatures: A Comparison between Stenothermal Antarctic and Eurythermal Temperate Eelpouts (Zoarcidae)”, Van Dijk, Tesch, Hardewig, Portner -- Journal of Experimental Biology 202, 1999
[http://epic.awi.de/Publications/Dij9999a.pdf]). Published in 1999, it is interesting that the words listed first in the paper key word list are: “global warming”. The study states: “The critical temperature threshold was found to be between 21 °C and 24 °C in Z. viviparous. Z. viviparus may be naturally exposed to stressful temperatures, especially at its southern distribution limit at the latitude of northern France, where maximum summer water temperatures can exceed 20 °C. Therefore, it can be anticipated that changes in summer maximum temperatures due to global warming would cause a shift in the distribution of this species.”
The methods used in this earlier Portner study (cited above) are interesting: “Individual Z. viviparus were put in darkened 3 l containers filled with aerated water at 3±1 °C. About half of the water volume was replaced by fresh water of the same temperature on a daily basis. The water temperature was gradually increased at a rate of 3 °C per day. Initial trials did not show any physiological disturbances at water temperatures up to 18 °C. Fish were killed in three groups: after 24 h at 21 °C (N=5), after 24 h at 24 °C (N=4) and after 72 h at 24 °C (N=4). Control fish (N=5) were killed after 3 days at 3 °C. Antarctic eelpout, P. brachycephalum, were treated in a similar way. Water temperature was increased at a rate of 1 °C per day. Fish were killed after 24 h at 0, 3, 6 and 9 °C (N=5 for each group). The fish incubated at 10 °C were sampled after 10 h (N=5).” In other words, the temperature of the containers was raised from 3 to 24 degrees at a rate of 3 degrees per day, and then the fish were killed at various temperatures (i.e. they did not die on their own) to study the internal effects on the liver, oxygen consumption etc.
For the typical eelpout experience in the wild, the annual sea temperature goes from about 5 to 20 degrees in about 20 weeks as shown in the following figure from a different study.
Sea surface temperatures (SSTs) at Helgoland in several years of the 1990s [http://icesjms.oxfordjournals.org/cgi/content/full/62/7/1216]
Further data on sea temperatures can be seen from other studies, including “Variability of Physical Factors Relevant to Fisheries Production in the Mediterranean Sea, North Sea and Baltic Sea” (Lloret, Wegner, Lleonart, Stergiou, Fromentin, Mackenzie, Damm and Drakopoulos - Boletin Instituto Espanol de Oceanografia, 2006) [http://www.ieo.es/publicaciones/boletin/pdfs/bol22/22-13.pdf]. The following figure is from that study, showing sea temperatures for two sea basins. The above figure (Helgoland) is for the location labeled “HE” on the map in the following figure.
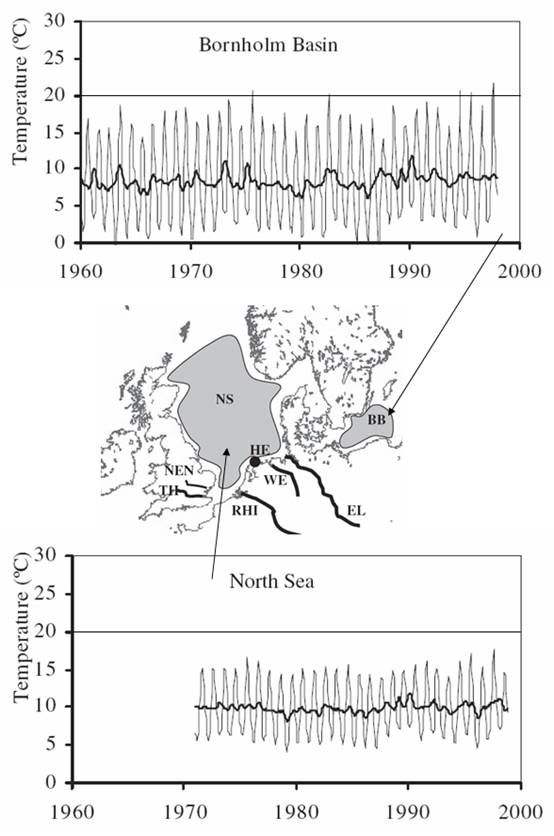
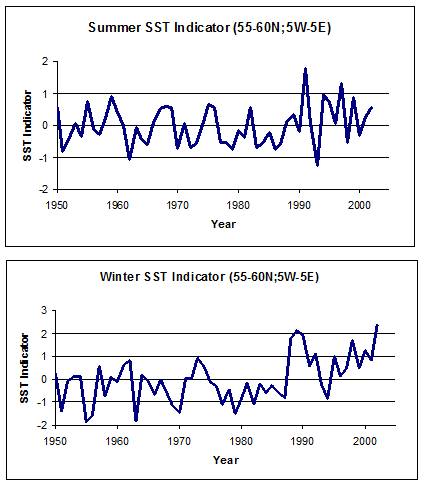
Although from a northern part of the North Sea, the following figures provide an indication of relative warming trends, showing that the winter SSTs have been increasing more than the summer SSTs.
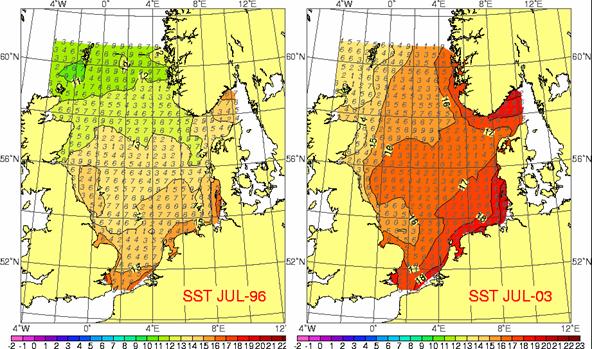
The following figure shows how variable sea temperatures can be, comparing the July temperatures for 1996 and 2003, as well as how temperatures vary throughout the North Sea. None of the temperatures in the warmer 2003 July reach 20 degrees.
The oxygen levels in the North Sea and Baltic Sea are greatly affected by the variations in river outflows and wind conditions. Nutrients entering the sea from rivers trigger phytoplankton blooms, which die after a few days and sink to the bottom. There they are decomposed by bacteria, which can deplete the oxygen dissolved in the water in a process called eutrophication. The oxygen saturation can drop to zero in extreme cases when offshore blowing winds drive surface water out and anoxic depth water rises up. (See: [http://www.economicexpert.com/a/Oxygen:depletion.htm]) A report on the eutrophication of Europe’s coastal waters states, in referring to the Baltic Sea: [http://reports.eea.europa.eu/topic_report_2001_7/en/topic_report_7_summary.pdf] “The highest load can be found in estuaries and coastal areas close to rivers that drain agricultural and densely populated areas. In the Greater North Sea eutrophication primarily affects the coastal zone. In particular, in estuaries and fiords, Wadden Sea, German Bight”.
Another study states: [http://icesjms.oxfordjournals.org/cgi/content/full/62/7/1492] “Anthropogenic pollution by both toxic compounds and nutrients has changed the environment in the Baltic Sea extensively. The amounts of phosphorus and nitrogen of anthropogenic origin have significantly increased since the middle of the last century.”
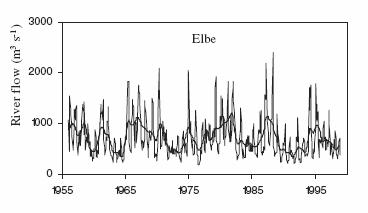
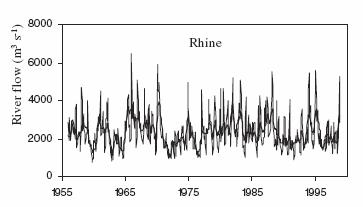
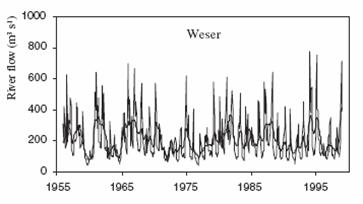
In the previous figure shown above, the warmest areas can be seen to be at the river outflows into the sea. The following figures show the river flows into the North Sea from 1955 to 2000 for the major rivers. These are the rivers labeled RHI, WE, and EL on the black-and-white map shown previously. The mid-1990s had extremely river flows into the North Sea.
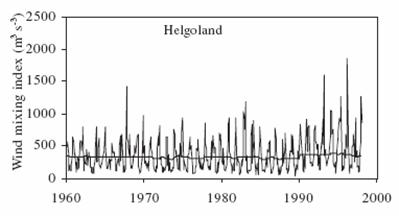
The following figure shows the wind mixing index flows into the North Sea at Helgoland (labeled HE on the black-and-white map). The extreme wind mixing and river outflow conditions combined to make highly eutrophic conditions in the mid- to late- 1990s. It’s no wonder that the new scientist Portner found reduced levels of eelpout in the warm areas of the North Sea.
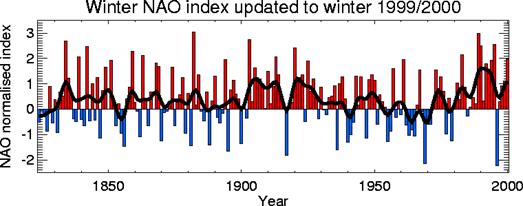
But these climatic events are related to the North Atlantic Oscillation. “The North Atlantic Oscillation (NAO) is a large-scale mode (i.e., pattern) of natural climate variability that has important impacts on the weather and climate of the North Atlantic region and surrounding continents, especially Europe.” According to the Hadley Climatic Research Unit (HadCRU - providers of data to the IPCC) [http://www.cru.uea.ac.uk/cru/info/nao/]. The following figure shows the NAO index from HadCRU. 1997 had one of the most drastic changes in the NAO ever observed as can be seen in the following figure.
The eelpout was originally a cold-water fish that adapted to warmer waters. A study of fish adaptation “The Impact of Climate Change on the Adaptation of Marine Fish in the Baltic Sea” -- Ojaveera, and Kalejsb, ICES Journal of Marine Science, 2005) [http://icesjms.oxfordjournals.org/cgi/content/full/62/7/1492] states: “During the last half-century, the biological productivity of the once-oligotrophic Baltic Sea has notably increased (Zenkevich, 1963; Ojaveer, 1988; Nehring and Matthäus, 1991). Prey abundance is one of the reasons for adaptation to new areas by populations of eelpout (Ojaveer and Lankov, 1997) and probably also other fish.” Adaptation happens (even while the alarmists claim apocalyptic scenarios).
The following graphic from the Danish newspaper Jyllands-Posten shows the progressive fish species migration for a couple of more tropical fish as they have expanded their range northward. [http://www.ices.dk/globec/data/presentations/Climate%20change%20and%20fish%20distribution%20in%20the%20North%20Sea.ppt]
It is significant that the fishes’ range expansion began before the recent global warming phase, which according to the IPCC began in the 1970s, and sea temperatures for the area have only been rising more recently. There is no evidence that any of this is caused by anthropogenic CO2.
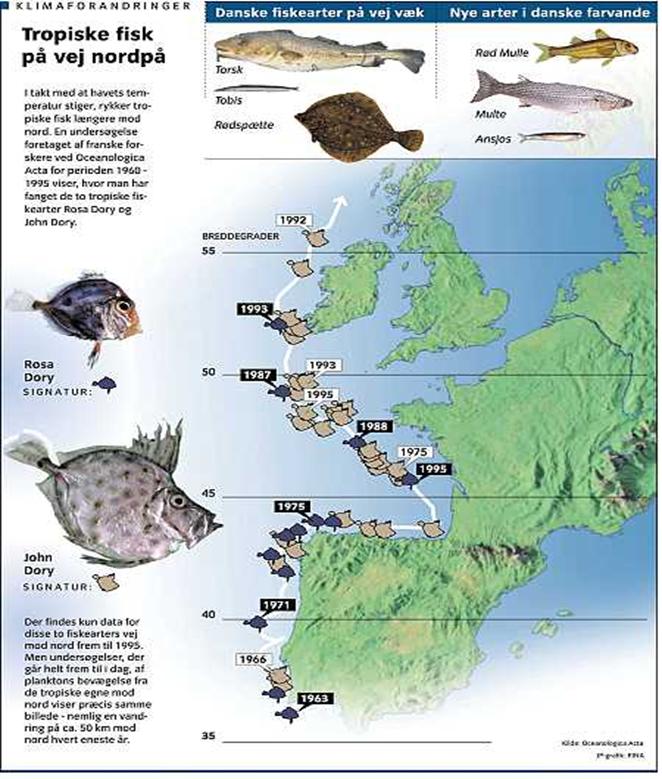
From the Jyllands-Posten Danish newspaper
See also: www.appinsys.com/GlobalWarming/RS_Baltic.htm for more information on temperature trends in and around the Baltic Sea.