Global Warming Science - www.appinsys.com/GlobalWarming
An Examination of Central Siberian Temperature Trends
[last update: 2009/12/16]
|
Central Siberia – CRU / IPCC Say It’s Warming
This document examines the available data from the NOAA Global Historical Climate Network (GHCN) and the Hadley Climatic Research Unit (HadCRU or CRU) databases for the Siberian region – one of the regions that actually exhibits some warming.
The data plots are from the AIS climate data visualizer – for links to the source data included see http://www.appinsys.com/GlobalWarming/climate.aspx. NOAA is the world’s primary temperature data collector. HadCRU uses the NOAA database as a starting point and adds other data and does their own adjustments to the data. Until December 2009, HadCRU (the primary data supplier to the IPCC) only published their adjsted 5x5 – degree gridded data but then released some station data. This document examines both.
Although some warm-mongers say there are multiple “independent” data sets, in fact all land-based data sets (including HadCRU) start with the NOAA GHCN database and make additions, subtractions and adjustments.
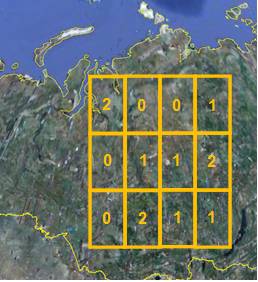
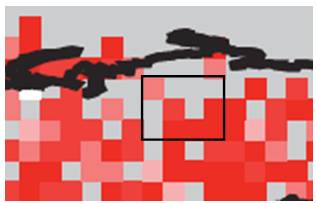
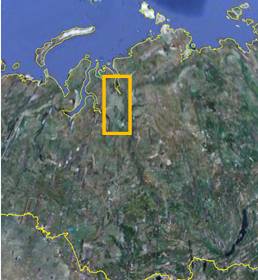
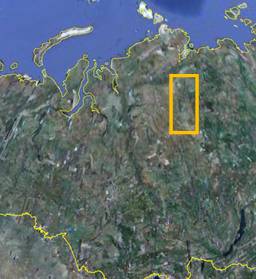
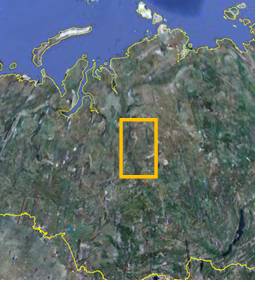
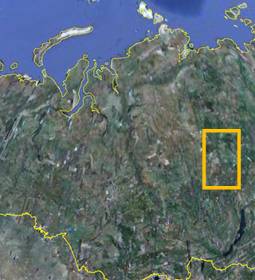
The following figure (below left) shows the number of GHCN stations in the 5x5 degree grids examined in this document. (The exact shapes of the grids are not accurate in this figure due to the curvature of the earth in the image.) The figure below right shows the “observed” warming according to the IPCC from 1979-2005 (from Figure 9.6 of the AR4 [http://ipcc-wg1.ucar.edu/wg1/Report/AR4WG1_Print_Ch09.pdf]). (The IPCC figure is inconsistent with the data in terms of which grids have data.)
The sections below the “Context” examine only the grids with at least one temperature station.
Steve McIntyre at Climate Audit [http://climateaudit.org/2009/12/16/iearussia-hadley-center-probably-tampered-with-russian-climate-data/] recently reported on the CRU emails discussing blocking publication of conflicting data on Siberia and the Russian IEA claiming that the CRU tampered with Russion data.
|
|
Context
Any examination of historical temperature trends should be made in the context of the IPCC presumptions.
In a CRU email between Edward Cook and Michael Mann in May 2001, Cook stated: “most researchers in global change research would agree that the emergence of a clear greenhouse forcing signal has really only occurred since after 1970. I am not debating this point, although I do think that there still exists a significant uncertainty as to the relative contributions of natural and greenhouse forcing to warming during the past 20-30 years at least.” [http://www.eastangliaemails.com/emails.php?eid=228&filename=988831541.txt]
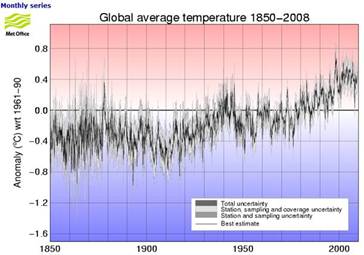
The figure below left shows the global average temperature anomalies (from the Hadley Climatic Research Unit (CRU) which provides the data used by the IPCC [http://hadobs.metoffice.com/hadcrut3/diagnostics/global/nh+sh/]).
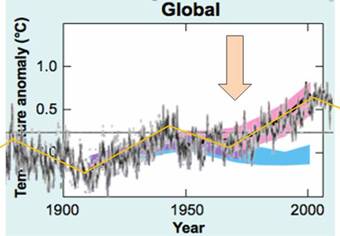
The figure below right superimposes the CRU temperature anomalies on the IPCC graph of model outputs. (IPCC 2007 AR4 Figure SPM-4 [http://www.ipcc.ch/pdf/assessment-report/ar4/syr/ar4_syr_spm.pdf]) In this figure, the blue shaded bands show the result climate model simulations using only natural forcings. Red shaded bands show the result model simulations including anthropogenic CO2.
This clearly shows that prior to about 1973, the global warming is fully explained by climate models using only natural forcings (i.e. no human CO2). The models need input of CO2 only after about the mid-1970s – prior to 1970 all warming was natural, according to the IPCC.
|
|
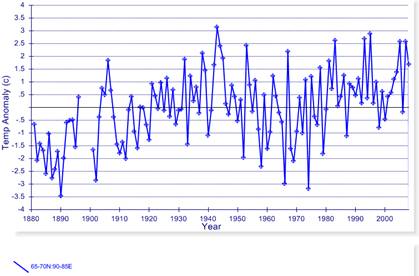
Grid: 65-70Nx85-90E
The following figure shows the HadCRU (CRUTEM3) data for the grid.
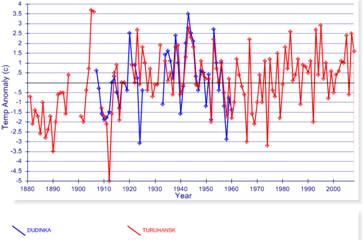
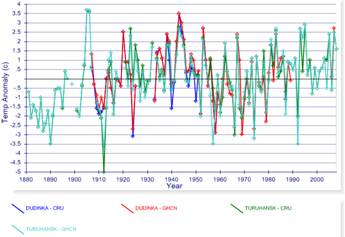
There are two stations in the NOAA GHCN database and in the CRU station data. The following figures show the CRU station data (left) and compare the CRU station data to the GHCN data (right) for the two stations.
Observations: There has been no warming since the 1930 – 1940s. Unprecedented warming? – Not.
|
|
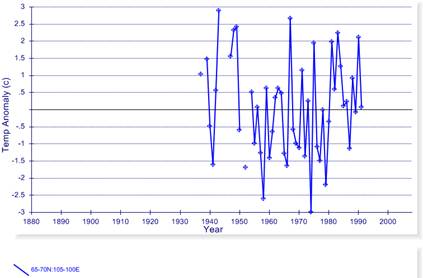
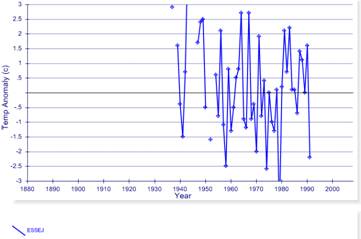
Grid: 65-70Nx100-105E
The following figure shows the HadCRU (CRUTEM3) data for the grid.
There is one station in the NOAA GHCN database and none in the CRU station data. The following figure shows the GHCN station.
Observations: The CRUTEM3 5x5 degree graph shows a distinctly different trend than the GHCN data. Lack of recent data. Unprecedented warming? No.
|
|
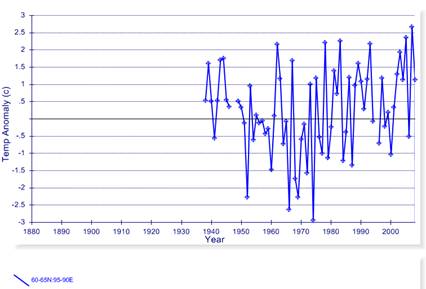
Grid: 60-65Nx90-95E
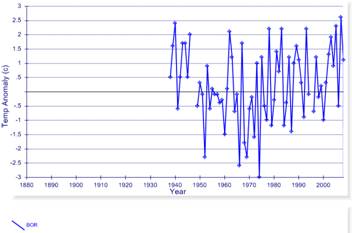
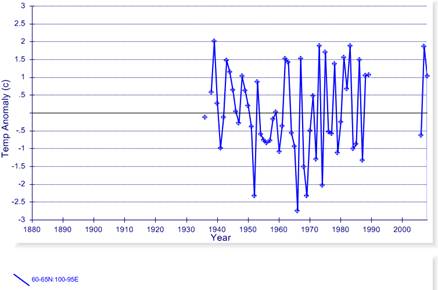
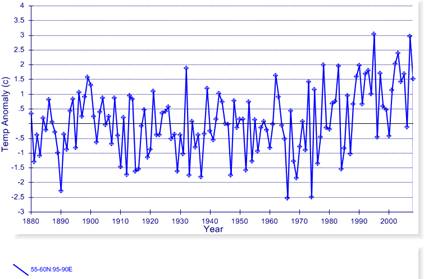
The following figure shows the HadCRU (CRUTEM3) data for the grid.
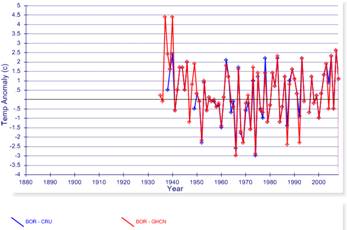
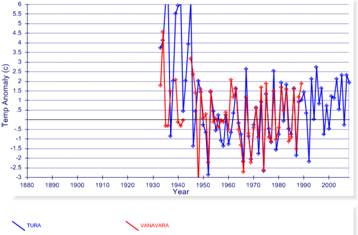
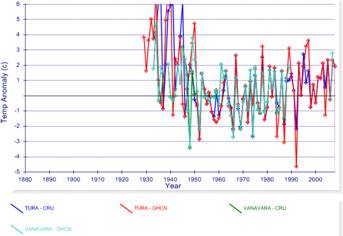
There is one station in the NOAA GHCN database and the same single station in the CRU station data (Bor). The following figures show the CRU station data (left) and compare the CRU station data (blue) to the GHCN data (red) (right).
Observations: The CRUTEM3 5x5 degree graph shows warming not exhibited at the station – except through “adjustments”. Artificial warming introduced. Unprecedented warming? – Not.
|
|
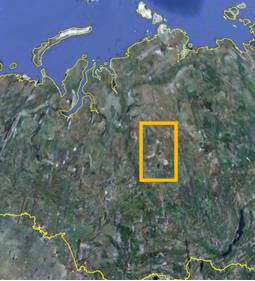
Grid: 60-65Nx95-100E
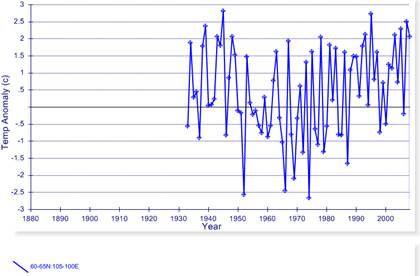
The following figure shows the HadCRU (CRUTEM3) data for the grid.
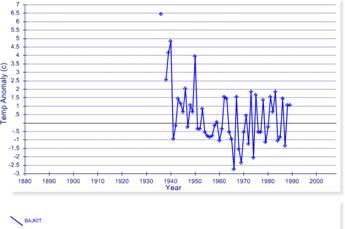
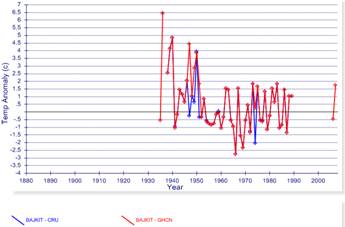
There is one station in the NOAA GHCN database and the same single station in the CRU station data (Bajkit). The following figures show the CRU station data (left) and compare the CRU station data (blue) to the GHCN data (red) (right).
Observations: The CRUTEM3 5x5 degree graph shows warming not exhibited at the station – except through “adjustments”. Artificial warming introduced. Unprecedented warming? – Not.
|
|
Grid: 60-65Nx100-105E
The following figure shows the HadCRU (CRUTEM3) data for the grid.
There are two stations in the NOAA GHCN database and the same stations in the CRU station data. The following figures show the CRU station data (left) and compare the CRU station data to the GHCN data (right).
Observations: The CRUTEM3 5x5 degree graph gets rid of the warm 1930s-1940s data exhibited at the station – “hide the decline?” Unprecedented warming? – Not.
|
|
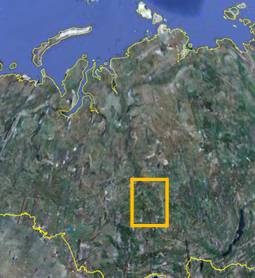
Grid: 55-60Nx90-95E
The following figure shows the HadCRU (CRUTEM3) data for the grid.
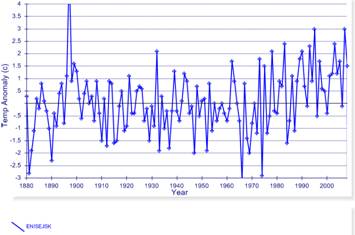
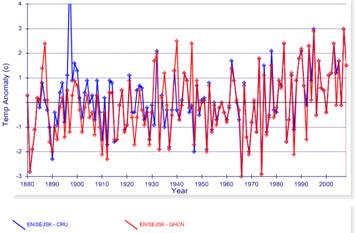
There are two stations in the NOAA GHCN database and only one station in the CRU station data (Enisejsk). The following figures show the CRU station data (left) and compare the CRU station data (blue) to the GHCN data (red) (right) for Enisejsk.
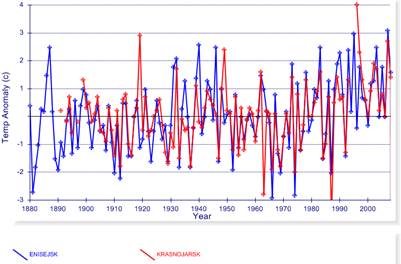
The following figure compares the two NOAA GHCN stations.
Observations: The CRUTEM3 5x5 degree graph shows warming occurring in the 1990s – 2000s. It reduces the variance from the station data to create a different impression than the individual station data. Recent warming is similar to the 1940s in the station data. The variance indicates that the recent warming is not statistically significant.
|
|
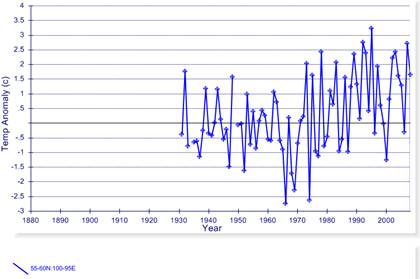
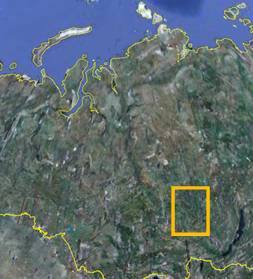
Grid: 55-60Nx95-100E
The following figure shows the HadCRU (CRUTEM3) data for the grid.
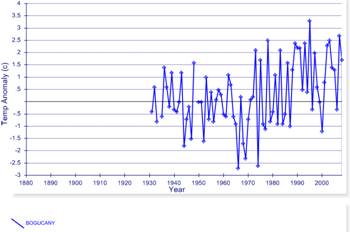
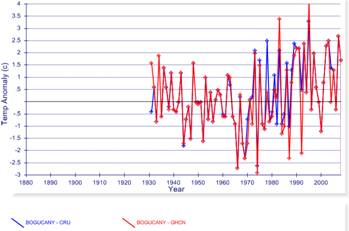
There is one station in the NOAA GHCN database and the same single station in the CRU station data (Bogucany). The following figures show the CRU station data (left) and compare the CRU station data (blue) to the GHCN data (red) (right).
Observations: The CRU adjustments create more of a warming trend where the variance of the GHCN station data indicates that the recent warming is not statistically significant.
|
|
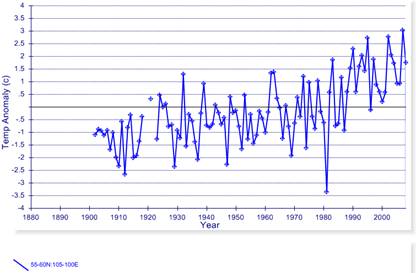
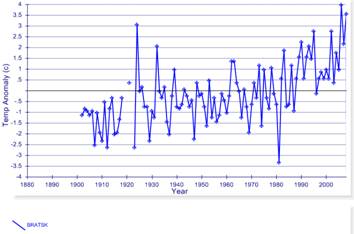
Grid: 55-60Nx100-105E
The following figure shows the HadCRU (CRUTEM3) data for the grid.
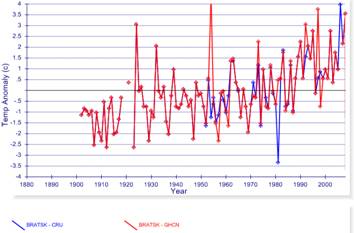
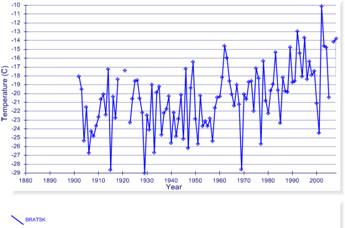
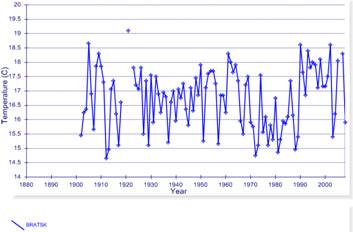
There is one station in the NOAA GHCN database and the same single station in the CRU station data (Bratsk). The following figures show the CRU station data (left) and compare the CRU station data (blue) to the GHCN data (red) (right).
Observations: The CRUTEM3 5x5 degree grid again portrays a different story than the single station used in the grid. This grid exhibits warming compared to any other grid in this study. This is also the only urban station in all of the grids examined.
The following figures show the Jan-Feb temperatures (left) and the July-Aug temperatures (right) from the GGHCN database. The warming has occurred in the winter – not the summer. This is consistent with the urban warming effect.
|
|
|