Global Warming Science - www.appinsys.com/GlobalWarming
Australian Sea Turtle Eggs Are Cookin’
[last update: 2010/02/03]
|
Alarmists tell us everything will die because of the human-caused warming earth. Now sea turtle eggs will die in the heat of the sand on Australia’s Great Barrier Reef. [http://news.discovery.com/animals/sea-turtles-global-warming.html]
From the above article: “When they emerge onto beaches around the world to lay their eggs in the sand, sea turtles expose themselves to a trio of threats from climate change: cyclones, rising seas and warming temperatures. A new study finds that for the world's largest population of sea turtles -- in Australia's northern Great Barrier Reef -- blazing hot sands pose the greatest threat to the animals' breeding success over the long term. The researchers predict that from now until 2030, sea level rise will do the most harm to turtle breeding grounds. However, by 2070, sands in many areas will be so scorching that eggs could not survive.”
|
|
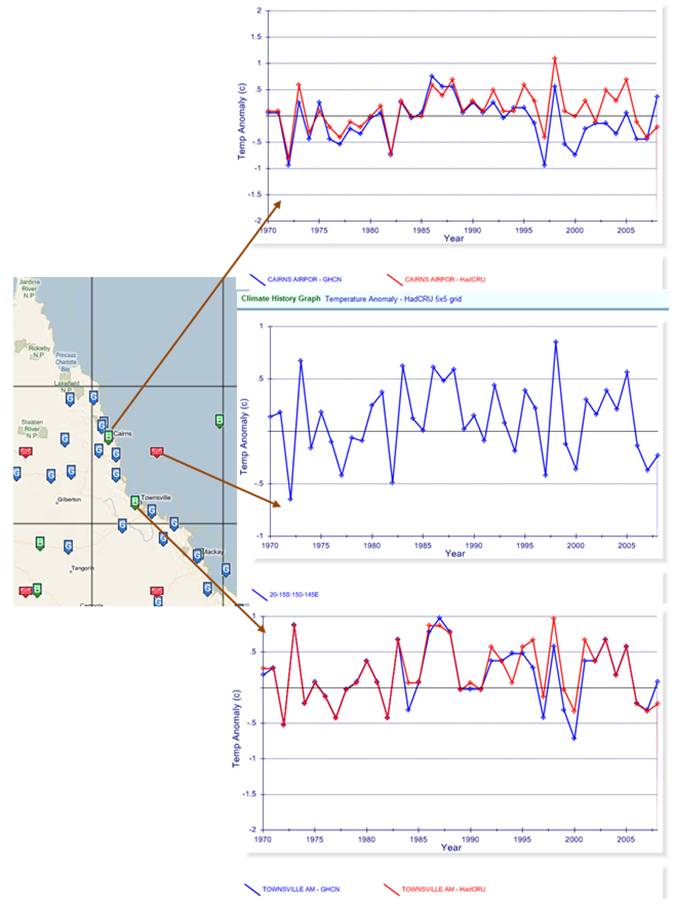
Great Barrier Reef Temperatures
The Great Barrier Reef is off the north-east shore of Australia. The following figures show average annual temperatures since 1970 for: Top: Cairns – red: HadCRU station data, blue: NOAA GHCN station data Middle: HadCRU (CRUTEM3) 5x5 degree grid data for the indicated grid Bottom: Townsville – red: HadCRU station data, blue: NOAA GHCN station data (graphs from http://www.appinsys.com/GlobalWarming/climate.aspx)
The IPCC has indicated that global warming prior to 1970 can be accounted for with natural forcings – the models only need CO2 after 1970 (see: http://www.appinsys.com/GlobalWarming/GW_Summary.htm), therefore 1970 was used as the starting point for these graphs. As can be seen from above, there has been no warming in the area of Australia adjacent to the Great Barrier Reef.
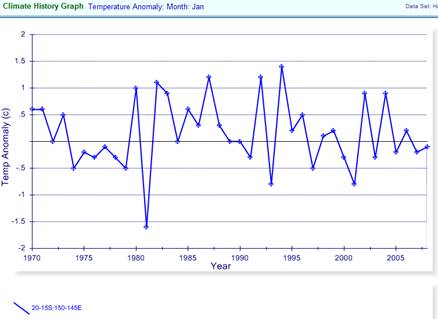
The above figures show annual average temperature – but turtle breeding season is in the austral summer and peaks in January. The following figure shows average January temperatures since 1970 from the HadCRU 5x5 degree grid. Again – no warming trend.
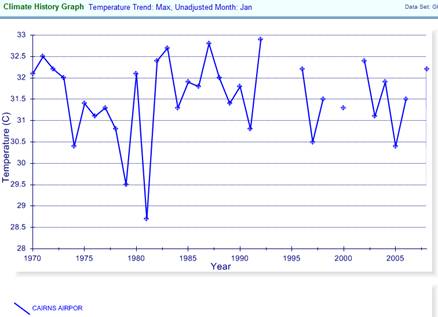
The following figure shows average maximum January temperatures since 1970 for Cairns from the GHCN database. Again – no warming trend.
The Discovery article states “by 2070, sands in many areas will be so scorching that eggs could not survive”. With no warming in the last 38 years, their models seem to be out to lunch.
|
|
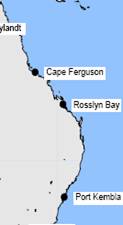
Great Barrier Reef Sea Level Rise
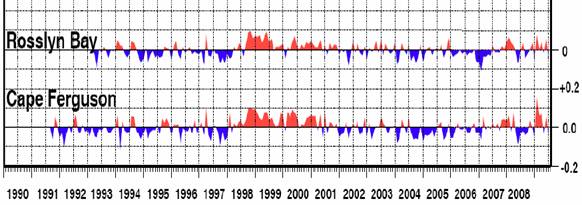
The following figure shows sea level anomaly data for the area of Australia adjacent to the Great Barrier Reef (from http://www.bom.gov.au/ntc/IDO60202/IDO60202.2009.pdf)
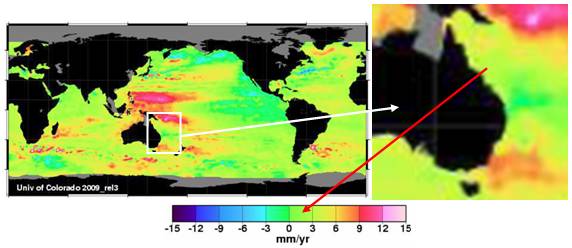
The following figure shows “global distribution of sea level trend (mm/yr) derived from Topex/Poseidon and Jason-1 satellite altimeter measurements from Dec 1992 to July 2009 with corrections for the inverse barometric pressure effect applied” (from the same source as above) and with the GBR area expanded.
Sea level has only been measured in this area since 1991 and satellite-based sea level data starts in 1992. With only 17 years of data, trends are affected by the start and end conditions.
The following figure shows the Southern Oscillation Index (related to El Nino – from same source referenced above).
The following figure compares the sea level anomaly data shown above for Cape Ferguson with the SOI. Sea level is highly correlated with the El Nino / Southern Oscillation (ENSO). The effect of the 1998 El Nino is very noticeable.
The Discovery article states “from now until 2030, sea level rise will do the most harm to turtle breeding grounds”. At the rate of sea level rise measured over the last 18 years, the sea level will be about 2 to 2.5 inches higher by 2030.
|
|
|